Anaconda installer now supports installation of bootc based bootable container images using the new bootc command. It has supported several types of payload to populate the root file system during installation. These include RPM packages (likely the most widely used option), tarball images you may know from Fedora Workstation, ostree, and rpm-ostree containers. The newest addition to the family, from a couple of weeks ago, is bootc-based bootable containers.
The difference is under the hood
We have added a new bootc kickstart command to Anaconda to support the new feature. This is very similar to the ostreecontainer command that has been present for some time. From the user’s perspective the two are very similar. The main difference, however, is under the hood.
One of the most important setup steps for a deployment is to create a requested partitioning in both cases. When the partitioning is ready, the ostreecontainer command makes Anaconda deploy the image onto the root filesystem using the ostree tool. It also executes the bootupctl tool to install and set up the bootloader. By contrast, with bootc containers installed using the bootc kickstart command, both the filesystem population and bootloader configuration is performed via the bootc tool. This makes the deployment process even more integrated.
The content of the container images used for installation is another difference. The bootc-enabled images are somewhat more versatile. Apart from installation using Anaconda, they provide a self-installing option via the bootc command executed from within a running container.
On the other hand, both options provide you with a way to install an immutable system based on a container image. This option may be useful for particular use cases where regular installation from RPM packages is not desired. This might be due to potentially lower deployment speed or inherent mutability of the resulting system.
A simple how-to
In practice, you’d likely use a custom container with pre-configured services, user accounts and other configuration bits and pieces. However, if you want to quickly try out how the new Anaconda’s feature works, you just need to follow a few simple steps. Starting with a Fedora Rawhide ISO:
First, take an existing container from a registry and create a minimal kickstart file instructing Anaconda to install the bootable container image:
# Beware that this kickstart file will wipe out the existing disk partitions.
# Use it only in an experimental/isolated environment or edit it accordingly!
zerombr
clearpart --all --initlabel
autopart lang en_US.UTF-8
keyboard us timezone America/New_York --utc
rootpw changeme bootc --source-imgref=registry:quay.io/fedora/fedora-bootc:rawhide
As a next step, place the kickstart file in some reachable location (e. g. HTTP server), point Anaconda to it by appending the following on the kernel command line:
inst.ks=http://url/to/kickstart
Now start the installation.
Alternatively, you may use the mkksiso tool provided by the lorax package to embed the kickstart file into the installation ISO.
When installation and reboot is complete, you are presented with an immutable Fedora Rawhide system. It will be running on your hardware (or VM) installed from a bootable container image.
Is there anything more about bootc in Anaconda?
You may ask if this option is limited to Fedora Rawhide container images. Technically speaking, you can use the Fedora Rawhide installation ISO to install, for instance, a CentOS Stream container image:
Nevertheless, keep in mind that for now Anaconda will handle it as Fedora installation in such a case. This is because it runs from a Fedora Rawhide boot ISO. This may result in unforeseen problems, such as getting a btrfs-based partitioning that CentOS Stream won’t be able to boot from. This particular issue is easily overcome by explicitly telling Anaconda to use some different partitioning type, e. g. autopart –fstype=xfs. We would like to address the lack of container images handling based on the contained operating system or flavour in the future. For now, one just needs to take the current behavior into consideration when using the bootc command.
There are a couple more known limitations in Anaconda or bootc at this point in time. These include lack of support for partitioning setups spanning multiple disks, support for arbitrary mount points, or for installation from authenticated registries. But we hope it won’t take long to solve those shortcomings. There are also plans to make the new bootc command available even on the RHEL-10 platform.
We invite you to try out this new feature and share your experience, ideas or comments with the Installer team. We are looking forward to hearing from you in a thread on discussion.fedoraproject.org!
Generative AI systems are changing the way people interact with computers. MCP (model context protocol) is a way that enables LLMs to run commands and use tools to enable live, conversational interaction with systems. Using the new linux-mcp-server, let’s walk through how you can talk with your Fedora system for understanding your system and getting help troubleshooting it!
Introduction
Large language models (LLMs) can be an invaluable tool when investigating an issue on a Linux system. However, this can involve a lot of copy/pasting of information from the Linux terminal into a web based interface to an LLM model.
The model context protocol (MCP) acts as a bridge, enabling LLMs to interact with external tools and data sources. The linux-mcp-server utilizes this protocol to give LLMs the ability to interact with a Fedora Linux system. Instead of you manually copying and pasting terminal output, the linux-mcp-server enables the LLM to directly query system information and log entries.
By enabling an LLM direct access to system information and logs, it is transformed into an active part of the investigation process when troubleshooting an issue. It empowers an LLM to directly query the system state, allowing it to help identify performance bottlenecks, and identify important log entries that might be missed by a manual review.
Prior to MCP, there wasn’t as strong a standard and ecosystem for LLM systems to call tools. LLMs were thus frequently limited to have only the information contained in their training. They were isolated from the outside world. For example, if you asked an LLM “what is the weather going to be next week”, the LLM would respond with a message indicating that it doesn’t know what the weather will be, as it doesn’t have access to that information. MCP helps solve this problem by enabling a standardized way for an LLM to access an outside data source, such as the weather forecast.
At a high level, users can use an AI agent application, such as Goose (open source), or Claude Desktop, and specify which MCP servers they would like to use. The AI agent application informs the LLM that there are tools available via these MCP servers that can be used to help answer the requests from the user. The LLM model can then decide when to invoke these tools.
MCP is an open standard. You have the flexibility to use MCP servers, such as linux-mcp-server, with either open source-licensed LLM models, or hosted proprietary LLM models.
What is the linux-mcp-server?
The linux-mcp-server is a project started by Red Hat’s RHEL Engineering team. It provides a number of tools that enable an LLM to query information from a Linux system, such as system info, service information and logs, process information, journald and other logs, network information, and storage and disk information. For a full list of the tools provided, refer to the project’s Github page.
These tools, provided by linux-mcp-server, are focused on providing the LLM access to read-only information. In the future, we’ll be exploring expanding past these read-only use cases.
The linux-mcp-server can be used to interact with the local Fedora Linux system that it is running on. It can also be used to interact with remote Fedora Linux systems over SSH. For example, if you have SSH key authentication setup with the remote systems, you could make a request to your AI agent application such as “Determine the current memory usage on the fedora1.example.com, fedora2.example.com, and fedora3.example.com servers”.
Prerequisites
The main components needed are an AI agent application, access to LLM model inference, and the linux-mcp-server.
There are a number of options for the AI agent application, both open source and proprietary. An example of an open source AI agent is Goose, which provides an RPM that can be installed on Fedora.
There are several LLM model inference options, ranging from locally hosted open source models, to proprietary hosted LLM models. If hosting a model locally, you generally need to have GPU/accelerator hardware available. Open source tools that can be used to locally host LLM models include RamaLama, llama.cpp, and Ollama. There are a number of open source LLM models capable of tool calling. These include models such as gpt-oss-20b and Granite 4 small.
Once you’ve installed your preferred AI agent application, the next step is to install the linux-mcp-server and configure your AI agent application to use it. The linux-mcp-server Github page includes installation instructions, and configuration details for Goose and Claude Desktop.
Use cases for linux-mcp-server
NOTE
The example scenarios below include LLM generated output. The output is presented here as it was generated by the AI systems cited so you can assess the quality of the output they are capable of, particularly in a non-cloud, self-hosted scenario.
The sample LLM output provided here is not intended to be run by readers without the same level of review we recommend anyone perform on AI generated content prior to use on their systems.
Dear Fedora, why are you so slow today?
Has this happened to you? Time to hop on a call and give a demo. You’re pumped. It’s your go-time aaaaand… your system starts lagging. Folks on the call say your video is choppy or they can’t understand you. OH NO.
You’ve got to assess what’s up, quickly. Run `top`, check `dmesg`, check your network connection (read the man page for `netstat` because you can’t remember the flag you want), check `journalctl`, cross-reference what you’re seeing, then start killing processes, restarting services, reloading kernel modules willy-nilly based on hastily-crafted theories, see if it improves…
This is a case where you could actually ask the system to tell you why it’s slow and give it the ability to do the analysis via linux-mcp-tools. The LLM you connect with won’t just run the commands through the MCP server; it will understand what the numbers it gets means in context and be able to explain in human terms.
So let’s start working with a relatively new laptop. It’s a Thinkpad T14S with the AMD Ryzen AI Pro 7 ( Ryzen AI 360 chip.) Recently one of the wifi networks it must connect to regularly was upgraded. It now has issues with the network connection stability. So let’s talk to Goose + gpt-oss:20b + linux-mcp-server about it. Here’s the initial prompt I used:
My Wifi doesn't work very well. It cuts out after a few minutes. Help me fix it. Can you find the error messages in the system logs and diagnose the problem?
It responded with the following:
I'll help you diagnose your WiFi connectivity issues by examining the system logs for error messages related to your network interfaces and wireless connectivity. Let me start by gathering information about your system and checking the relevant logs.
LLM output
I’ll help you diagnose your WiFi connectivity issues by examining the system logs for error messages related to your network interfaces and wireless connectivity. Let me start by gathering information about your system and checking the relevant logs.
It then made a series of tool calls, including Get System Information, Get Network Interfaces, Get Journal Logs, Get Hardware Information, Get Service Status service_name:NetworkManager, Get Service Status service_name:wpa_supplicant, Read Log File. The result was this analysis, which is the actual problem I was hoping it could find!
The “failed to enqueue rx buf: –28” is an internal driver allocation failure that typically follows one of two paths:
The driver or firmware is out of date → upgrade kernel/firmware.
The driver configuration is too aggressive for your system’s memory budget → tweak module parameters or free RAM.
If you're still stuck after following the quick‑fix path, it's worth capturing more detailed logs with the above diagnostic commands and sharing them. We can then cross‑reference the exact kernel version/driver commit to see if a known patch exists.
Feel free to let me know which step you’ve tried or if you encounter any new log messages, and we’ll dig deeper!
Not too bad an analysis and set of debugging steps! I’ll follow up in the comments and let you know if the solution works.
Where’d my disk space go, Fedora?
Trawling through `du` on the command line, converting the numbers in your head, sorting them – it can be tedious. We even have graphical tools like `baobab`, but it takes time to load in the results and explore the data. And sometimes you might have questions it can’t answer in terms of the risk of deleting a specific directory, or the age of a specific file. It’s easier to be sloppy and just let the disk fill up. But there comes a time where that is no longer an option.
You can ask the system using the linux-mcp-server to analyze your disk usage, give you a hitlist of the top space-eating places on the file system, and give you advice with a risk analysis of how to clean it up.
Here’s my prompt:
I need help analyzing disk usage on my system. Can you: 1. Show me the current disk usage across all filesystems using get_disk_usage
2. Use list_directories_by_size to show me the 10 largest directories (this will help identify where disk space is being consumed)
3. Check if there are any large log files consuming space using get_journal_logs or read_log_file
4. Review running processes with list_processes to see if any are consuming excessive resources or creating temporary files After gathering this information, help me identify potential space-saving opportunities and assess the safety of cleaning up specific directories. Please don't only examine top-level directories. I want you to go deep if needed to find out where the largest files are!
I ran this prompt on my Fedora 42 system using linux-mcp-server with Goose connected to locally-served gpt-oss:20b, and here’s the output I got:
LLM output
Disk‑space overview (as of Nov 24 2025 15:21)
Filesystem
Size
Used
Avail
Use %
Mounted on
/dev/mapper/luks‑61cedb0e…
952.3 GB
548.9 GB
399.6 GB
57.9 %
/
/dev/mapper/luks‑61cedb0e…
952.3 GB
548.9 GB
399.6 GB
57.9 %
/home
/dev/nvme0n1p2
973.4 MB
462.8 MB
443.4 MB
51.1 %
/boot
/dev/nvme0n1p1
598.8 MB
19.3 MB
579.6 MB
3.2 %
/boot/efi
Overall usage is comfortably below 60 % of a 952 GB volume, so immediate capacity pressure isn’t a concern. The biggest contributors to disk space today are in the ~/. hierarchy.
1. Biggest directories on the system
Path (relative to the mount point)
Size (≈)
Notes
~/ – User home (2 mounts: /home + /)
1 TB total
57 % used; the bulk of the space is in ~/
| ~/duffy/.local/share | 238 GB | Containers sub-dir, followed by Trash (7GB) – typical podman/docker container images | | ~/duffy/.local/share/containers | 238 GB | Container layers, images, root filesystems – the prime candidate for cleanup | | ~/duffy/.local | 266 GB | share (237 GB) dominates it | | ~/duffy/.local/share/containers (inside share) | 238 GB | Same as above – just a different view | | ~/duffy/.local/lib | 13 GB | Likely a virtual‑environment library set | | ~/duffy/.local/bin | 4 GB | Helper binaries | | ~/duffy/.local/share/Trash | 7 GB | User‑deleted items still resident on disk | | ~/duffy/.local/share/containers (nested) | 238 GB | Same as above; redundant listings from recursive depth‑1 scans | | ~/duffy/.local/share (top‑level) | 238 GB | containers is the absolute largest item |
Take‑away – 75 % of the 238 GB live inside three nested directories:
~/duffy/.local/share/containers (238 GB) → Rooted in Podman/Container‑Store
~/duffy/.local/share (238 GB) → Same data exposed at a higher level
~/duffy/.local/share/Trash (7 GB)
2. Possible space savers
Category
Recommendation
Rationale
Containers
podman system prune -a (or docker system prune -a if Docker is in use)
Removes unreferenced images, containers, and caches. This can reclaim 200–250 GB if most containers are outdated or no longer referenced.
Trash
gio trash –empty
The 7 GB in Trash is still taking physical space; simply emptying it will free that amount.
Large libs/binaries
Check ~/duffy/.local/lib – 13 GB, and ~/duffy/.local/bin – 4 GB
If these are not actively used by a project, consider uninstalling or moving them to a secondary, less‑frequented store.
Ramalama & UV
9 GB (ramalama), 8 GB (uv)
Possibly temporary files or caches from development tools. Inspecting the contents of these directories (du -h) can reveal if they are still needed.
Other caches
pnpm store prune, virtualenv or pip cache purge
Development tool caches often accumulate; they’re usually safe to delete once you’re done with the current development sessions.
Logs
The system journal shows normal activity, and syslog access is blocked by policy.
Systemd journal stores are rotated automatically; no urgent action required.
Boot partitions
Not relevant – they’re low‑usage (boot/efi only 3 % used).
If writes are high relative to free space, consider enabling a tmpfs overlay for temporary files or moving large data to a separate, faster SSD. But in this case, writes are not approaching the 399 GB free.
4. Suggested cleanup workflow
# 1. Empty Trash
gio trash --empty
# 2. Prune unused containers/images
podman system prune -a # or docker system prune -a
# 3. Remove leftover caches
pnpm store prune # if pnpm is installed
pip cache purge # for Python
virtualenv --clean # optional
# 4. Inspect large “RAM” directories manually if you need deeper cleanup
du -h --max-depth=1 ~/duffy/.local/share/containers
Tip: After each step run df -h /home or du -sh ~/duffy/.local/* to see the impact.
5. Safety checklist
Action
Why it’s safe (or risk)
Emptying Trash
Deletes only user‑deleted files; confirm you don’t need the content.
podman system prune -a
Deletes container images, containers, and volumes that are not referenced by any running or stopped container. Verify with podman ps -a before pruning.
Removing lib/bin from .local
Only safe if you’re sure those libraries/bin files aren’t part of a running application.
Caution with tmpfs or moving large directories
If you move a directory on‑the‑fly, ensure no running application depends on that path.
Bottom line
Current free space: ≈ 400 GB on both / and /home.
Largest consumptions: User‑space under ~/duffy/.local/share/containers (≈ 238 GB).
Actionable clean‑ups: Empty Trash, prune unused container images, and review large libraries/binaries. This should reclaim over 200 GB and bring the usage from 57.9 % down to roughly 40‑45 % – plenty of headroom for the future.
Feel free to ask what next steps you’d like to dig into (e.g., detailed contents of the containers dir, specific application logs, or targeted pruning commands).
Upgrade planning
So you may have noticed a little detail above – the system is a Fedora 42 system… and Fedora 43’s been out a month now! So, time to upgrade.
This example shows where we have some tools missing from the set provided in the linux-mcp-server. We’re including it for two reasons:
So you can see how this works manually You can see that even when specific tools you might not need are available in the MCP server, you can have the response give you instructions on commands to run on your own, and copy/paste the command output back into your chat to get analysis alongside the data the system is able to pull via the MCP tool calls;
Here’s the prompt I started with, with the same Goose + gpt-oss:20b + linux-mcp-server combination:
You are a Linux system administrator assistant analyzing a Fedora system for upgrade readiness. TASK: Examine this Fedora 42 system and provide a comprehensive upgrade readiness report for Fedora 43. ANALYSIS CHECKLIST:
1. Check current Fedora version: cat /etc/fedora-release
2. Review system updates status: dnf check-update
3. Identify third-party repositories: dnf repolist
4. List installed packages from non-Fedora repos: dnf list installed | grep -v @fedora
5. Check for broken dependencies: dnf check
6. Review disk space on root partition: df -h /
7. Check for unsupported or deprecated packages
8. Identify custom kernel modules: lsmod | grep -v "^Module"
9. Review SELinux status: sestatus
10. Check for pending system updates: dnf upgrade --refresh --assumeno REPORT FORMAT: # Fedora 43 Upgrade Readiness Report ## Current System Status
- Fedora version: [version]
- Kernel: [kernel version]
- Updates status: [current/outdated] ## Potential Issues
[List blocking issues with HIGH/MEDIUM/LOW severity] ## Third-Party Software
[List non-Fedora packages that may need attention] ## Recommendations
[Specific pre-upgrade steps needed] ## Overall Readiness: [READY/NEEDS ATTENTION/NOT READY]
Run the necessary commands and provide this analysis. Be specific about any issues found and give actionable recommendations.
Now, right away the model came back to me to complain it doesn’t have access to `dnf`, `cat`, etc. And that’s expected here. What it did was give me a list of homework to run for it to complete the analysis… for example, `dnf check-update` and `cat /etc/fedora-release`. I had a little back and forth in Goose with the model where it would ask me to run a command and I’d copy the output into the context. This resulted, finally, in the following report:
LLM output
Fedora 43 Upgrade Readiness Report
Analyzed System – Fedora 42 (Kernel 6.17.7‑200.fc42.x86_64) Date – 2025‑11‑24
sudo sed -i ‘s/SELINUX=permissive/SELINUX=enforcing/’ /etc/selinux/config
Make enforcement permanent.
5. Post‑Upgrade Actions
Reboot into the new kernel (dnf system-upgrade reboot).
Re‑compile any custom kernel modules against the new kernel (yum install kernel-devel-$(uname -r) then rebuild modules).
Re‑enable any disabled repos once the upgrade completes.
Verify critical services (systemctl status <service>) and check logs.
Run sudo dnf distro-sync to ensure all packages are the latest from Fedora 43.
6. Overall Readiness
Criteria
Status
Comment
Disk space
Ready
58 % free
Package health
Ready
No held or broken packages
Third‑party repos
Conditional
Verify 43‑compatibility
Custom modules
Pending
Need to identify modules and re‑compile
Final verdict
READY (after addressing above points)
Next step – Run the three verification commands below and share the output with me:
sudo dnf check
sudo dnf repolist
dnf list installed | grep -v @fedora
With those outputs I can pinpoint any remaining blockers and give you a final, ready‑to‑proceed plan.
Happy upgrading!
Give it a try, let us know what you think!
You can see from these few examples that tool calling with LLMs is a valuable tool for troubleshooting Linux systems. We could use your help building this and making it awesome! How can you help?
We’re primarily working with Goose as our client, but if you have another preferred client and want to help us support it better, we’d love to work with you!
Get involved in the linux-mcp-project generally, we’d love to see your PRs!
Let us know what you’d like to see in the future. What workflows would you like to see supported? How do you see this making your Fedora or overall Linux experience better? What larger workflows do you see this plugging into?
If you’re interested in running Linux on your Android device, you’re in luck! It’s possible to install Fedora Linux on Android using Termux. Termux is a terminal emulator for Android that allows you to run Linux commands and utilities on your phone or tablet. It does not replace Android. In this article, we’ll walk you through the process of installing Fedora Linux on Android using Termux and show you how to keep it up to date with the latest versions.
Step by step process
Step 1: Install Termux
To get started, you need to install Termux from the Google Play Store. Once you have Termux installed, open it up and type the following command to update the package list:
pkg update
Note: Termux requires Android >= 7 to run. Support for Android 5 and 6 was dropped at v0.83 on 2020-01-01, but you can find old builds on archive.org ( https://archive.org/details/termux-repositories-legacy/ ) if needed.
Step 2: Install Proot-Distro
Next, you’ll need to install Proot-Distro. Proot-Distro is a tool that allows you to install and run Linux distributions in a chroot environment. To install Proot-Distro, run the following command:
pkg install proot-distro
Step 3: Install Fedora
With Proot-Distro installed, you can now use it to install Fedora. To install Fedora, run the following command:
proot-distro install fedora
This will download and install the latest version of Fedora.
Step 4: Configure dnf
Now that you have Fedora installed, you’ll need to configure dnf, Fedora’s package manager. By default, dnf may try to install SELinux packages, which won’t work properly in a chroot environment. To prevent this, exclude SELinux packages installation by editing the dnf configuration file. Run the following command to open the dnf configuration file for editing :
cd ../usr/var/lib/proot-distro/installed-rootfs/fedora/etc/dnf
vi dnf.conf
You may substitute the nano editor for vi, if it is more to your liking. Once you’re in the file, find the line that says excludepkgs= and add *selinux* to the end of the line, like so:
excludepkgs=*selinux*
It may be necessary to add the excludepkgs line. Save these changes and exit the editor.
Step 5: Install a Desktop Environment (Optional)
Fedora comes with a number of desktop environments to choose from. If you’d like to install a desktop environment, you can do so with the following commands:
This will switch from termux into the chroot Fedora installation and install the GNOME desktop environment, along with a number of other packages. If you prefer a different desktop environment, you can replace Fedora Workstation with the name of the group for your preferred environment.
Step 6: Install VNC Server (Optional)
If you plan on using your Fedora installation with a graphical interface, you’ll need to install a VNC server. This will allow you to connect to the Fedora desktop from another computer or device. To install the TigerVNC server, run the following command:
dnf install tigervnc-server.aarch64 -y
This will install the VNC server, along with any necessary dependencies.
Step 7: Upgrading Fedora
Now that you have Fedora installed, you’ll want to keep it up to date with the latest versions. To upgrade Fedora, run the following commands:
First command sudo dnf upgrade –refresh refreshes the package cache and updates any installed packages.
The second command sudo dnf install dnf-plugin-system-upgrade installs the dnf-plugin-system-upgrade package, needed for the upgrade process.
The third command sudo dnf system-upgrade download –releasever=37 downloads the necessary packages for the upgrade to version 37 of Fedora. Replace 37 with the desired release version.
The fourth command export DNF_SYSTEM_UPGRADE_NO_REBOOT=1 sets an environment variable to prevent the system from rebooting after the upgrade.
The fifth command sudo -E dnf system-upgrade reboot reboots the system to start the upgrade process. Make sure to save any important work before running this command.
The sixth command sudo -E dnf system-upgrade upgrade performs the upgrade process.
Finally, the seventh command sudo dnf upgrade –refresh updates any remaining packages and ensures that your system is fully up to date.
Errors Encountered
During the installation and upgrade process, you may encounter errors. Two common errors are described below, along with their solutions.
Error 1: sudo: /etc/sudo.conf is owned by uid 1001, should be 0 Solution: This error occurs when the ownership of the sudo.conf file is incorrect. To fix this, run the following command:
chmod +s /usr/bin/sudo
This sets the setuid bit on the sudo command, which allows it to run with root privileges.
Error 2: filesystem package didn’t get upgraded post OS upgrade Solution: This error occurs when the filesystem package is not upgraded during the upgrade process. To fix this, run the following commands:
The first command removes the filesystem package, and the second command downloads the latest version of the package. If you encounter any errors during the upgrade process, you can use rpmrebuild to rebuild the package with any necessary modifications.
Conclusion
In this article, we’ve shown you how to install Fedora Linux on Android using Termux and how to keep it up to date with the latest versions. While there may be some errors to overcome during the installation and upgrade process, following the steps outlined in this article should help you get Fedora up and running on your Android device in no time.
In previous installments (Fedora 32, Fedora 35), there was a strong focus on making things work with Docker on Fedora Linux. This article will focus on the final stage of this long journey. It will focus on migrating a cross-platform production set-up from Docker to Podman.
Background
Docker and Podman use the same open standard for containers. On top of this container standard, there are multiple ways of organizing containers together. Docker-Compose and Kubernetes are the two main technologies for this, although tools like Ansible are also popular.
On the business side though, there are strong differences. Docker is distributed with a non-free application called Docker Desktop, while Podman historically never had a UI. Docker started live in 2013 and had its rise to prominence in 2016. Podman started in 2018 and it has only become more popular in the last two years.
Podman was certainly not the first on the scene, and it has been fighting an uphill battle. Still, in many ways, this has been an opportunity. Podman can avoid some of the architectural errors that Docker made, and it can integrate with other tools that didn’t exist yet when Docker started.
Personal background
The previous articles about Docker and Fedora are based on the author’s professional life. At the company were I work, we heavily relied on Docker when I came on board. This meant that I needed Docker, and I started to document my struggles which ultimately lead to the first article. The second article was a follow-up to inform readers that most hurdles from the past were no longer a problem.
Podman Destkop
The game-changer in this whole story is Podman Desktop. It is a cross-platform UI that allows teams on Linux, macOS and Windows to collaborate. It works the same way as Docker Desktop, including a bundled VM and WSL support. This also means that Podman now offers a complete package for software companies. While software developers on Linux could use Podman in the past, it’s now possible to migrate an entire team across environments!
Migrating Docker
So, let’s start migrating from Docker to Podman. First, you’ll need to make sure that you have podman and podman-compose installed. You can easily download Podman Desktop from Flathub.
Image files
Image files are good as they are! They are identical because of the open standards behind containers.
One thing that you will see now is that there are a plethora of companies and groups that offer their own image-repositories.
hub.docker.com (alias, docker.io) is the offering from Docker, which their tooling conveniently defaults to.
registry.gitlab.com is the registry of GitLab’s commercial offering. Community editions follow this same syntax resulting in, for example: registry.gitlab.gnome.org
registry.fedoraproject.org is Fedora’s Registry. This registry is also used for flatpaks from the Fedora repository.
Quay.io is the offering from Red Hat, which contains all of Podman’s tooling, but also CentOS images.
The biggest change that you’ll have to adapt to, when switching from Docker to Podman, is that you’ll be encouraged to write full image addresses instead of just stubs: `postgres:14-alpine` becomes `docker.io/library/postgres:14-alpine`.
Docker-Compose files
Compose files are Docker specific and they can’t be used with Podman. What you can use, though, is podman-compose. Better yet, you can start your docker-based platform and then use Podman Desktop to export your current configuration to a Kubernetes file.
$ podman-compose -f ./docker-compose-platform.yaml up --detach
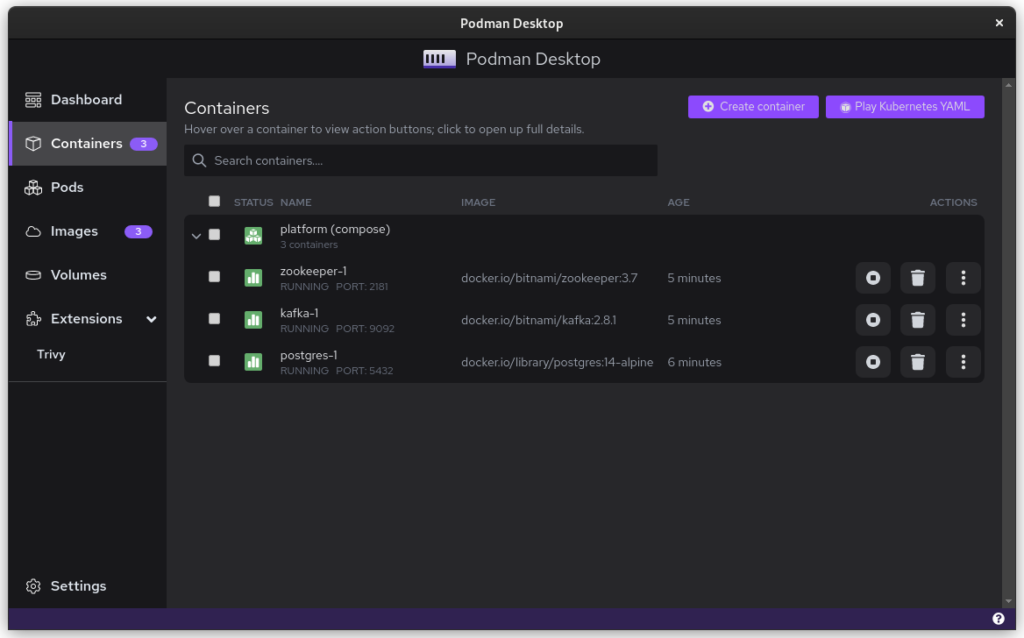
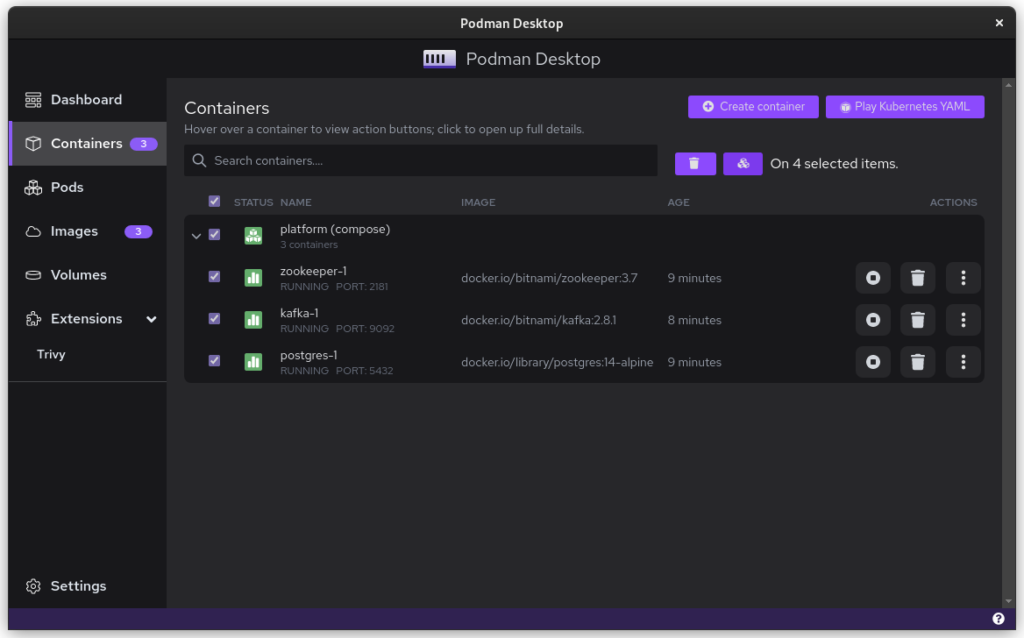
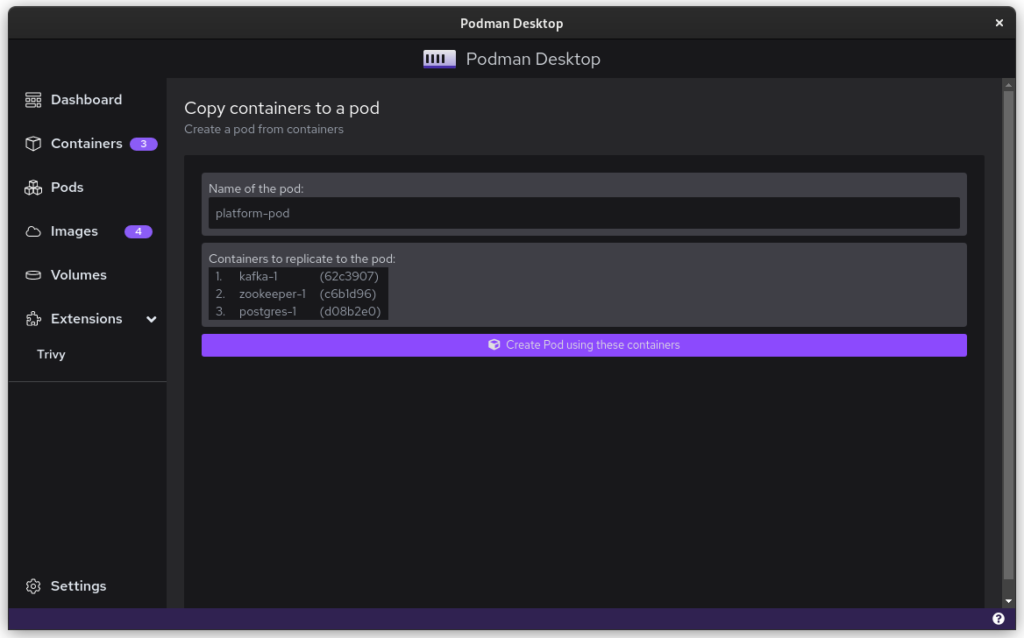
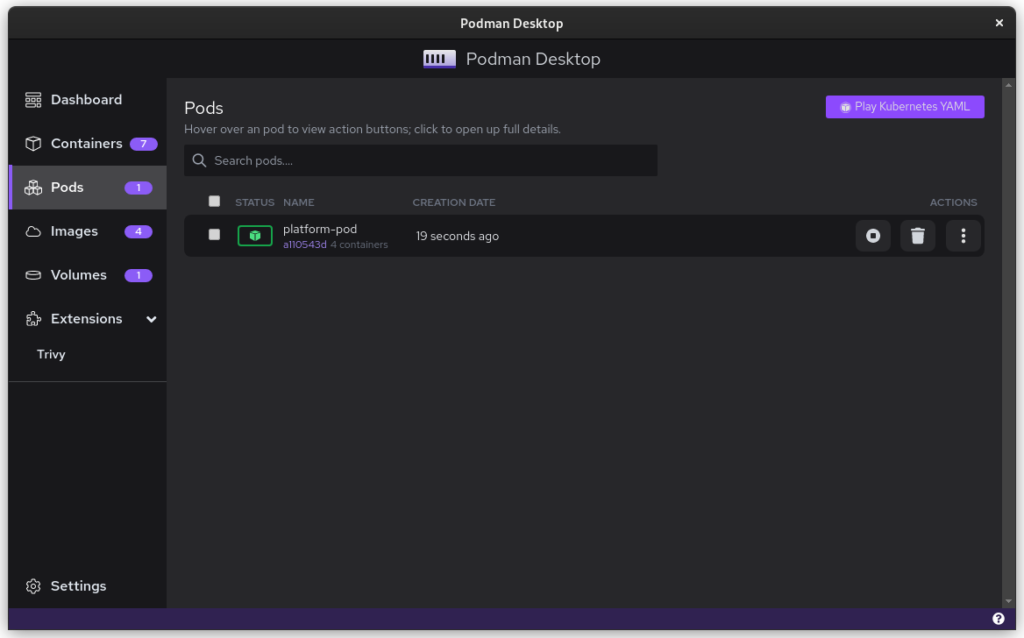
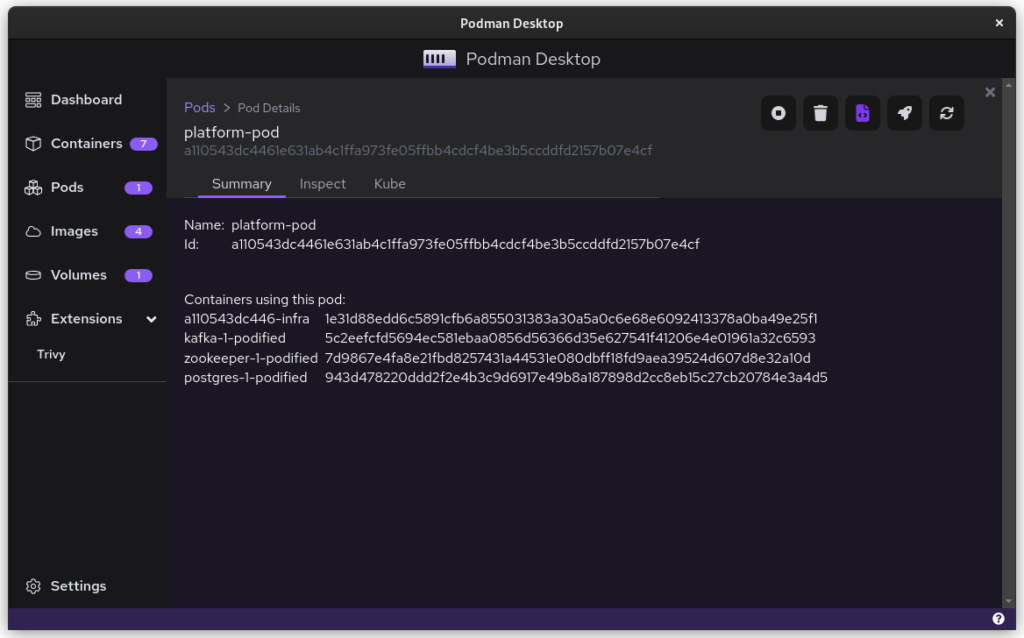
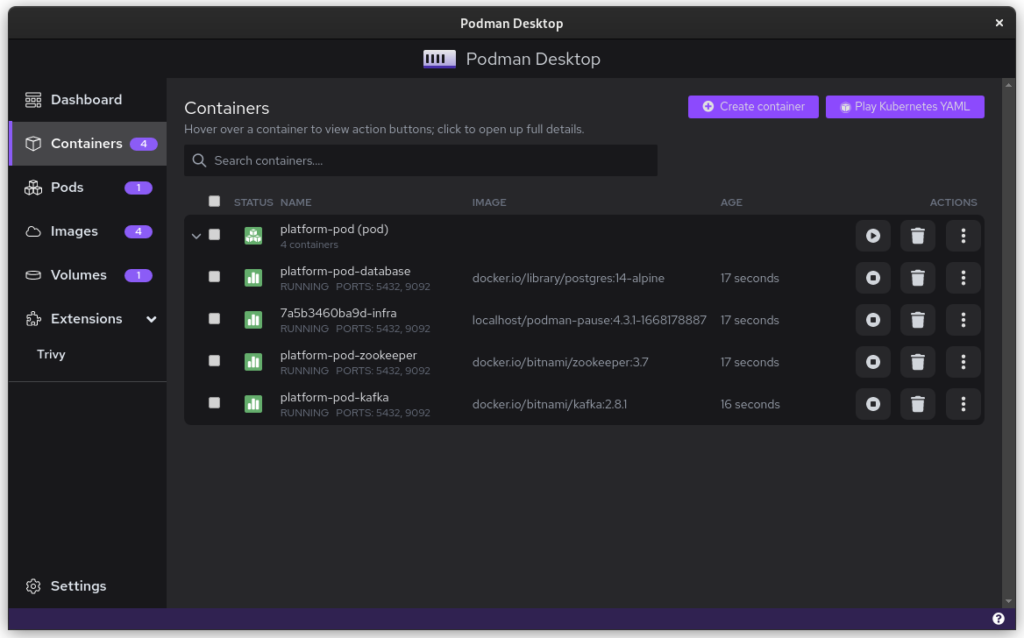
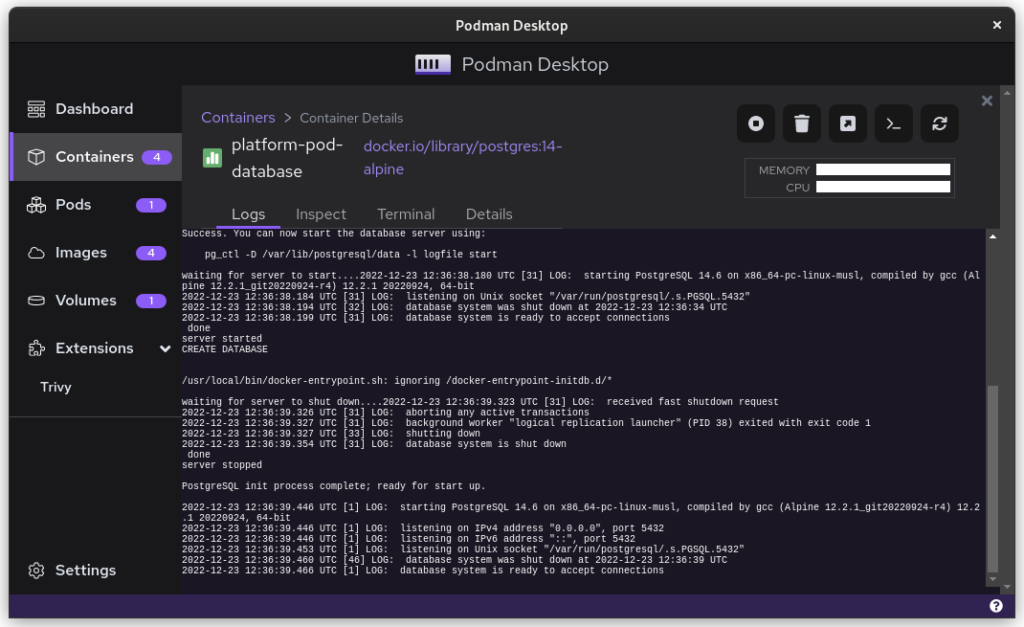
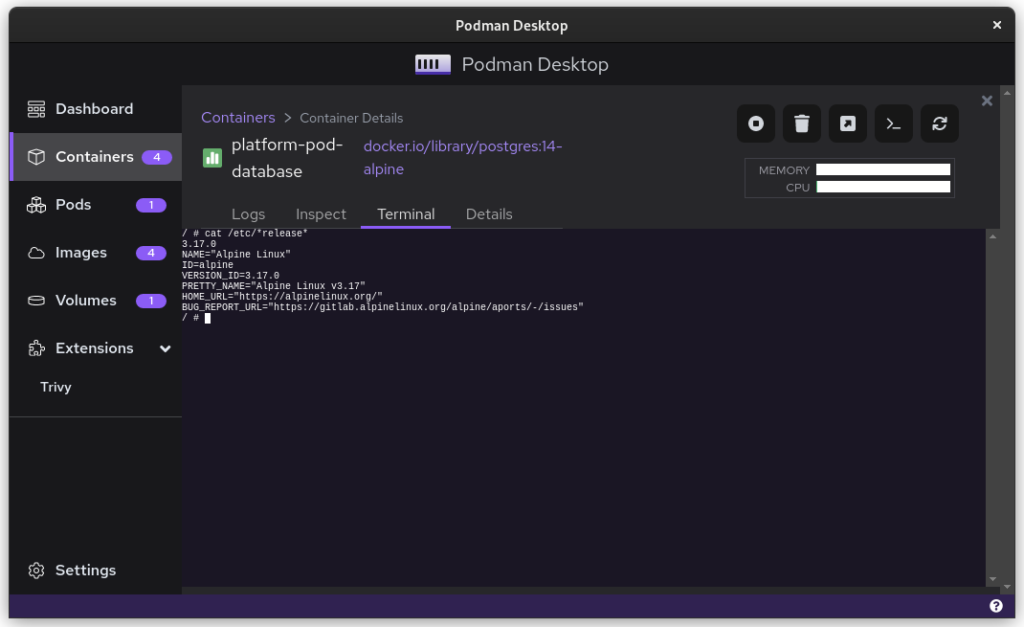
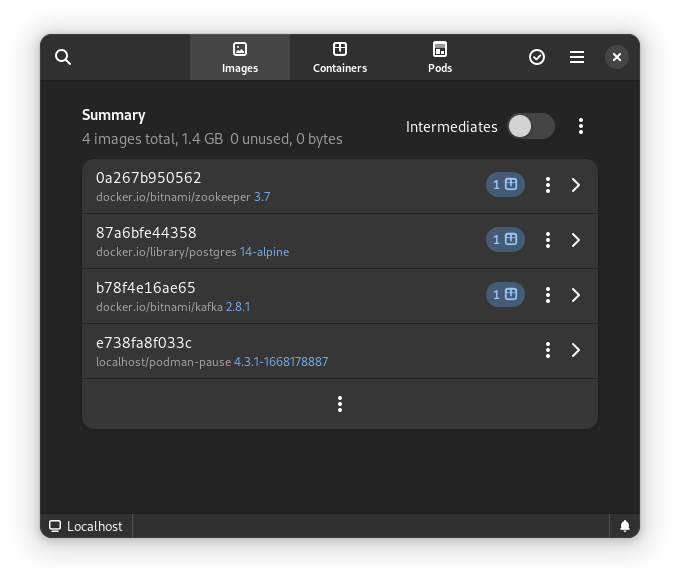
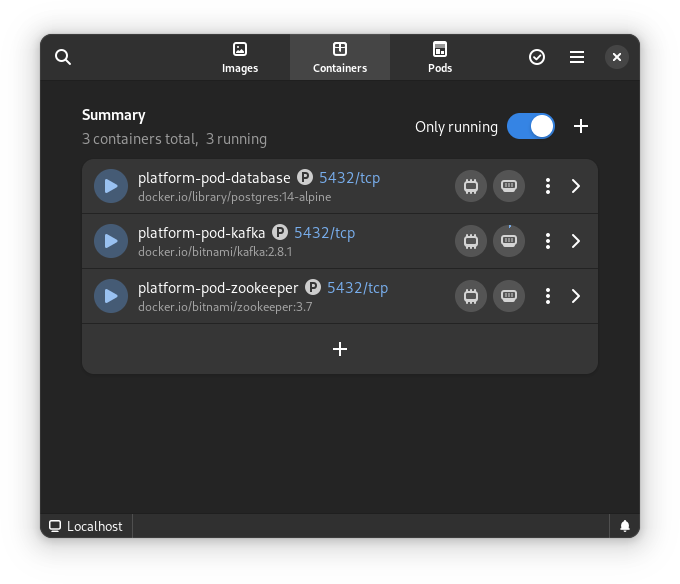
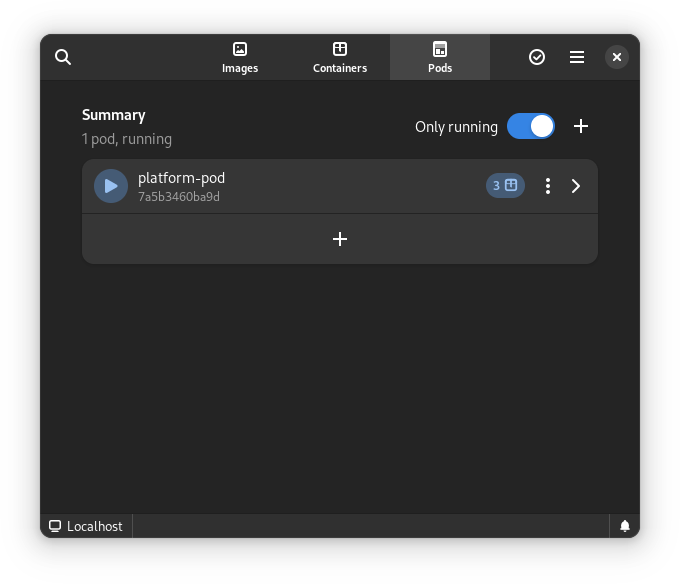
Once you start podman-compose with your old docker-compose .yaml file, you’ll see that you have a number of containers running in one ‘compose’ group. This is how things translate into the world of Podman. From here, you can select the containers and create a Pod. A Pod is a collection of containers that run in their own network.
Containers as started with `podman-compose`
Select all to creat a new pod
Name the pod
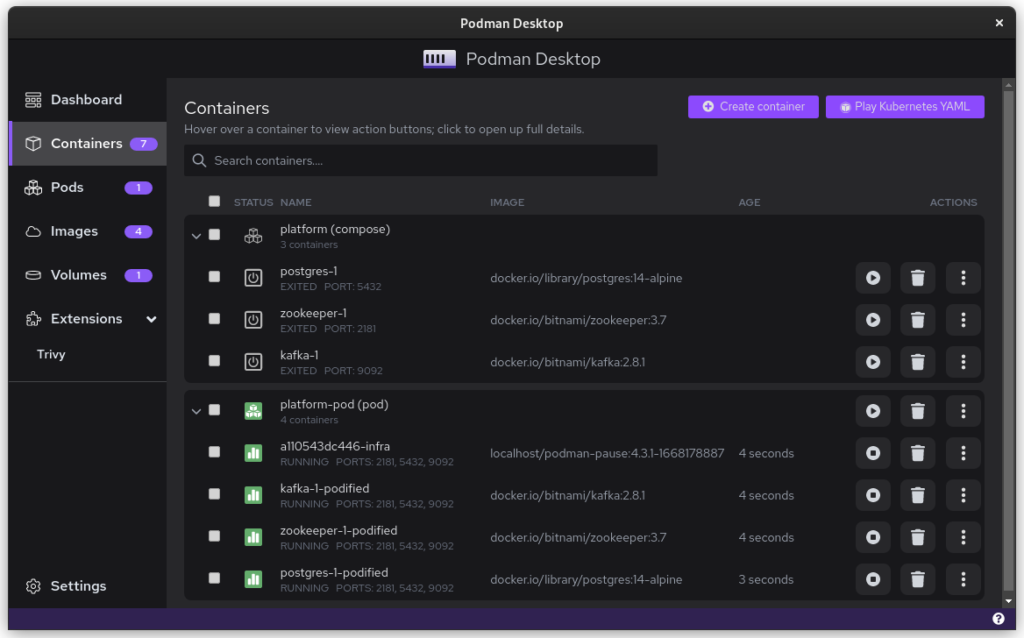
The pod replaced the podman-compose containers
There is a single pod
Logging relate to the pod
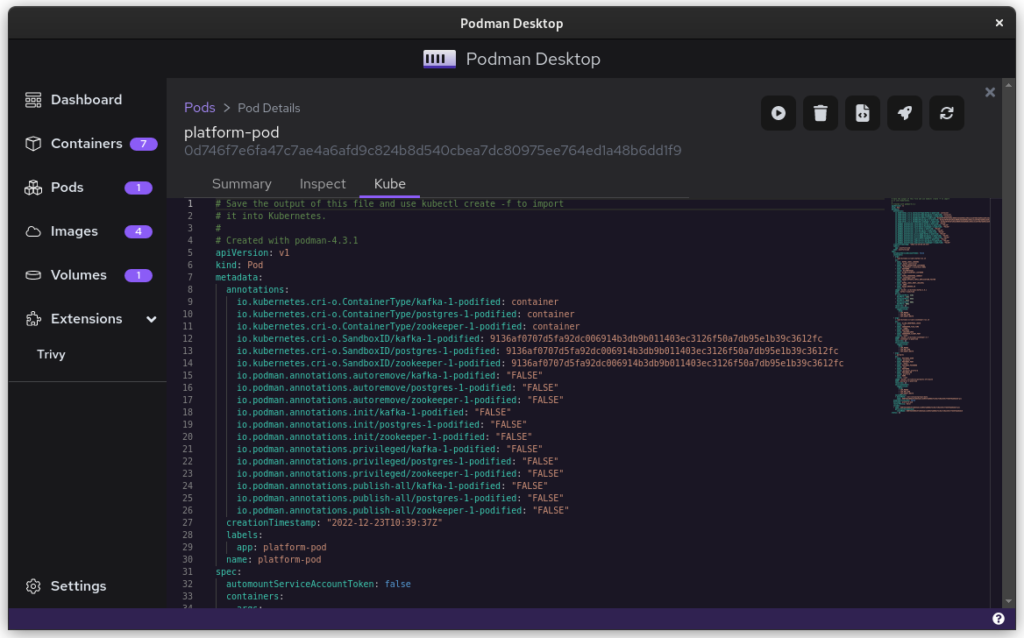
The Kube file to export
Once you inspect the Pod, you have a Kube file that represents this container collection. Save it somewhere and give it another critical look. You can likely remove some stuff without impacting the functioning of the system. After all, auto-generated documents will have some artifacts.
All three files from the demonstration can be seen here:
That’s it. You have now migrated from Docker to Podman. To start up Podman with the Kubernetes file simply do:
$ podman play kube podman-kube-platform-cleanup.yaml --replace
GitLab CI/CD
GitLab has a great set of open source and commercial offerings that allow you to automatically deploy and test your system. In the past, people working with Docker inside GitLab had to resort to a Docker-in-Docker solution. That gives many engineers headaches. A migration from Docker to Podman will resolve that problem.
For example, you can use Podman’s official image to easily build your own product image:
In this example we use the official Podman stable image based on Fedora Linux 37. We use that to build the latest version of our platform based on the ./distribute/image file. We can do this all without ever having to set up Docker.
Tooling and integrations
Finally, we have to talk about certain tooling. Not all tooling will work equally well from the start. For example, the login that Amazon’s AWS CLI provides is hardcoded for Docker. Still, you can easily login to AWS by doing this:
Perhaps all of this sounds good, but you need more time to convince your team and company that embracing open source tools is great. In that case, you can add the following snippet to .bashrc and use Podman without changing the tooling of your team.
#Ensure that these aliases also affect other scripts
shopt -s expand_aliases alias docker=podman
alias docker-compose=podman-compose
This also offers you a chance to test the set-up that you have, in case of technical incompatibilities. You can also use the package podman-docker (available via dnf) to automatically convert Docker commands into Podman commands.
Company experience
The migration from Docker to Podman has been well received within my development team. The desktop experience for macOS and Windows users has improved since they no longer have to struggle with a tool that is closed source. The improvements to the CI system also help in maintaining the pipeline and it makes the integration tests run faster.
In day to day work, the team is really enthusiastic about the ease with which they can inspect running containers, manage images, and clean temporary volumes.
In the big picture, the migration from Docker to Podman further aids the company in limiting financial liabilities. Developers on macOS and Windows are no longer dependent on a closed-source product. Finally, it also means that the team gets some experience in Kubernetes, which will certainly pay off in the future.
Summary
The gains from switching to Podman really outweigh the bit of time it takes to set up and to migrate. The future is bright for Podman and Podman Desktop, and it offers a great solution to the problems that come with Docker.
Finally, for us Fedora Linux users, there is another great benefit. There is some beautiful tooling in development that can make our lives so much easier. The following screenshots are of the application Pods. This is currently in active development but will certainly prove to be a useful tool in the future.
This article has been made possible by my employer, Bold Security Technologies. Got your own migration stories to share? Let us know in the comments.
We are excited to announce the first public preview image of the new Anaconda web interface! Our vision is to reimagine and modernize our installer’s user experience (see our blog post “Anaconda is getting a new suit”). We are doing this by redesigning the user experience on all fronts to make it more easy and approachable for everyone to use.
Today, we would like to introduce our plans for the public preview release, as our new project has already reached a point where core code functionality is already developed and the new interface can be used for real installations.
So, we’re giving you something to play with!
Why public preview image?
By giving you a working ISO as soon as we can, you have the opportunity to help us to define this new UI. This task allows us to rethink what we have and find new ways to overcome the challenges of the UI instead of re-creating what we had already. Please take this opportunity and reach us with your feedback to help us to create the best OS installer ever!
Please let us know what you require from Anaconda. What featuresare important to you and why are these important? That will allow us to prioritize our focus on development and design. See below for how to contact us.
Thanks a lot to the Image Builder team for providing us with a way to build ISO with the Fedora 37 Workstation GA content. We are planning to provide additional images with an updated installer to give you the newest features and fixes with the link above. There are no updates to the installation payload (installed system data) yet. We will announce important updates of the ISO image by sending mail to anaconda-devel@lists.fedoraproject.org with CC to devel@lists.fedoraproject.org. Please subscribe to either of these to get information about the news. This way we will be able to iterate on your feedback.
What you will get with the preview ISO
The ISO will allow you to install the system and let you get a taste of the new UI, so you can provide us early feedback. However, it is pretty early in the development cycle. We advise you to not use this ISO to install critical infrastructure or machines where you have important data.
Let’s go to the more interesting part of what you can do with the ISO:
Choose installation language
Select your disks
Automatically partition the disks. BEWARE! This will erase everything on the selected disks.
Automatically install Fedora 37 GA Workstation system
Basic review screen of your selections
Installation progress screen
Built-in help (on Installation destination screen only)
Known issues:
In the bootloader menu you’ll see “Install Fedora 38”, it’s expected because the installation environment is from Rawhide. However, the content installed will be Fedora 37 GA, so don’t worry.
Virtual Box on Mac might have resolution issues. We are working on resolving this issue.
Aspect ratio and window handling. We know we need to solve this better, feedback is welcome.
How to provide feedback?
Your feedback is critical to have a project which you and we can be proud of, so please share it with us. To give us feedback:
Please take your time to play with the UI and tell us what you think. What works great, what is not working and what you would like to have. Ideally, follow future updates and tell us if the situation is better or worse.
We are really counting on your feedback and we are thankful to have you all supporting us in this journey!
As automation expands to cover more aspects of IT, more administrators are learning automation skills and applying them to ease their workload. Automation can ease the burden of repetitive tasks and add a level of conformity to infrastructure. But when IT workers deploy automation, there are common mistakes that can wreak havoc on infrastructures large and small. Five common mistakes are typically seen in automation deployments.
Lack of testing
A beginner’s mistake that is commonly made is that automation scripts are not thoroughly tested. A simple shell script can have adverse affects on a server due to typos or logic errors. Multiply that mistake by the number of servers in your infrastructure, and you can have a big mess to clean up. Always test your automation scripts before deploying in large scale.
Unexpected server load
The second mistake that frequently occurs is not predicting the system load the script may put on other resources. Running a script that downloads a file or installs a package from a repository may be fine when the target is a dozen servers. Scripts are often run against hundreds or thousands of servers. This load can bring supporting services to a stand still or crash them entirely. Don’t forget to consider end point impact or set a reasonable concurrency rate.
Run away scripts
One use of automation tools is to ensure compliance to standard settings. Automation can make it easy to ensure that every server in a group has exactly the same settings. Problems may arise if a server in that group needs to be altered from that baseline, and the administrator is not aware of the compliance standard. Unneeded and unwanted services can be installed and enabled leading to possible security concerns.
Lack of documentation
A constant duty for administrators should be to document their work. Companies can have frequent new employees in IT departments due to contracts ending or promotions or regular employee turnover. It is also not uncommon for work groups within a company to be siloed from each other. For these reasons it is important to document what automation is in place. Unlike user run scripts, automation may continue long after the person who created it leaves the group. Administrators can find themselves facing strange behaviors in their infrastructure from automation left unchecked.
Lack of experience
The last mistake on the list is when administrators do not know enough about the systems they are automating. Too often admins are hired to work positions where they do not have adequate training and no one to learn from. This has been especially relevant since COVID when companies are struggling to fill vacancies. Admins are then forced to deal with infrastructure they didn’t set up and may not fully understand. This can lead to very inefficient scripts that waste resources or misconfigured servers.
Conclusion
More and more admins are learning automation to help them in their everyday tasks. As a result, automation is being applied to more areas of technology. Hopefully this list will help prevent new users from making these mistakes and urge seasoned admins to re-evaluate their IT strategies. Automation is meant to ease the burden of repetitive tasks, not cause more work for the end user.
MLCube is a new open source container based infrastructure specification introduced to enable reproducibility in Python based machine learning workflows. It can utilize tools such as Podman, Singularity and Docker. Execution on remote platforms is also supported. One of the chairs of the MLCommons Best Practices working group that is developing MLCube is Diane Feddema from Red Hat. This introductory article explains how to run the hello world MLCube example using Podman on Fedora Linux.
Yazan Monshed has written a very helpful introduction to Podman on Fedora which gives more details on some of the steps used here.
Then, following the documentation, setup a virtual environment and get the example code. To ensure reproducibility, use a specific commit as the project is being actively improved.
Now change the runner command from docker to podman by editing the file $HOME/mlcube.yaml so that the line
docker: docker
becomes
docker: podman
If you are on a computer with x86_64 architecture, you can get the container using
mlcube configure --mlcube=. --platform=docker
You will see a number of options
? Please select an image: ▸ registry.fedoraproject.org/mlcommons/hello_world:0.0.1 registry.access.redhat.com/mlcommons/hello_world:0.0.1 docker.io/mlcommons/hello_world:0.0.1 quay.io/mlcommons/hello_world:0.0.1
Choose docker.io/mlcommons/hello_world:0.0.1 to obtain the container.
If you are not on a computer with x86_64 architecture, you will need to build the container. Change the file $HOME/mlcube.yaml so that the line
build_strategy: pull
becomes
build_strategy: auto
and then build the container using
mlcube configure --mlcube=. --platform=docker
To run the tests, you may need to set SELinux permissions in the directories appropriately. You can check that SELinux is enabled by typing
sudo sestatus
which should give you output similar to
SELinux status: enabled
...
Josphat Mutai, Christopher Smart and Daniel Walsh explain that you need to be careful in setting appropriate SELinux policies for files used by containers. Here, you will allow the container to read and write to the workspace directory.
mlcube run --mlcube=. --task=hello --platform=docker
mlcube run --mlcube=. --task=bye --platform=docker
Finally, check that the output
cat workspace/chats/chat_with_alice.txt
has text similar to
Hi, Alice! Nice to meet you.
Bye, Alice! It was great talking to you.
You can create your own MLCube as described here. Contributions to the MLCube examples repository are welcome. Udica is a new project that promises more fine grained SELinux policy controls for containers that are easy for system administrators to apply. Active development of these projects is ongoing. Testing and providing feedback on them would help make secure data management on systems with SELinux easier and more effective.
Having a server with Samba providing AD and Domain Controller functionality will provide you with a very mature and professional way to have a centralized place with all users and groups information. It will free you from the burden of having to manage users and groups on each server. This solution is useful for authenticating applications such as WordPress, FTP servers, HTTP servers, you name it.
This step-by-step tutorial about setting up Samba as an AD and Domain Controller will demonstrate to you how you can achieve this solution for your network, servers, and applications.
Pre-requisites
A fresh Fedora Linux 35 server installation.
Definitions
Hostname: dc1 Domain: onda.org IP: 10.1.1.10/24
Considerations
Once the domain was chosen, you can’t change it, be wise;
In the /etc/hosts file, the server name can’t be on 127.0.0.1 line, it must be on its IP address line;
Use a fixed IP address for the server, as a result, the server’s IP won’t change;
Once you provision the DC server, do not provision another one, join other ones to the domain instead;
For the DNS server, we will choose SAMBA_INTERNAL, so we can have the DNS forwarding feature;
It is necessary to have a time synchronization service running in the server, like chrony or ntp, so you can avoid numerous problems from not having the server and clients synchronized with the same time;
Samba installation
Let’s install the required software to get through this guide. It will provide all the applications you will need.
For setting up Samba as an AD and Domain Controller, you will have to prepare the environment with a functional configuration before you start using it.
Firewall
You will need to allow some UDP and TCP ports through the firewall so that clients will be able to connect to the Domain Controller.
I will show you two methods to add them. Choose the one that suits you best.
First method
This is the most straightforward method, firewalld comes with a service with all ports needed to open Samba DC, which is called samba-dc. Add it to the firewall rules:
To run a Samba DC and running with SELinux in enforcing mode, it is necessary to set some samba booleans for SELinux to on. After these booleans are set, it should not be necessary to disable SELinux.
Restore the default SELinux security contexts for files:
sudo restorecon -Rv /
Samba
First, remove the /etc/samba/smb.conf file if it exists:
sudo rm /etc/samba/smb.conf
Samba uses its own DNS service, and for that reason, the service won’t start if systemd-resolved is running, that is why it is necessary to edit its configuration to stop listening on port 53 and use Samba’s DNS.
Create the directory /etc/systemd/resolved.conf.d/ if it does not exist:
sudo mkdir /etc/systemd/resolved.conf.d/
Create the file /etc/systemd/resolved.conf.d/custom.conf that contains the custom config:
The ‐‐use-rfc2307 argument provides POSIX attributes to Active Directory, which stores Unix user and group information on LDAP (rfc2307.txt).
Make sure that you have the correct dns forwarder address set in /etc/samba/smb.conf. Concerning this tutorial, it should be different from the server’s own IP address 10.1.1.10, in my case I set to 8.8.8.8, however your mileage may vary:
Changing the dns forwarder value on /etc/samba/smb.conf file
After changing the dns forwarder value, restart samba service:
sudo systemctl restart samba
Kerberos
After Samba installation, it was provided a krb5.conf file that we will use:
As a result of smbclient command, shows that connectionwas successful.
Anonymous login successful
        Sharename       Type      Comment
        ---------       ----      -------
        sysvol          Disk
        netlogon        Disk
        IPC$            IPC       IPC Service (Samba 4.15.6)
SMB1 disabled -- no workgroup available
smbclient connection test
Now, test the Administrator login to netlogon share:
Password for [ONDA\Administrator]:
  .                              D        0  Sat Mar 26 05:45:13 2022
  ..                             D        0  Sat Mar 26 05:45:18 2022

                8154588 blocks of size 1024. 7307736 blocks available
smbclient Administrator connection test
DNS test
To test if the name resolution is working, execute the following commands:
$ host -t SRV _ldap._tcp.onda.org.
_ldap._tcp.onda.org has SRV record 0 100 389 dc1.onda.org.
$ host -t SRV _kerberos._udp.onda.org.
_kerberos._udp.onda.org has SRV record 0 100 88 dc1.onda.org.
$ host -t A dc1.onda.org.
dc1.onda.org has address 10.1.1.10
If you get the error:
-bash: host: command not found
Install the bind-utils package:
sudo dnf install bind-utils
Kerberos test
Testing Kerberos is important because it generates the required tickets to let clients authenticate with encryption. It heavily relies on correct time.
It can’t be stressed enough to have date and time set correctly, and that is why it is so important to have a time synchronization service running on both clients and servers.
We started out by installing Samba and required applications in a fresh Fedora Linux 35 installation. We’ve also explained the problems that this solution solves. Thereafter, we did an initial configuration that prepares the environment to be ready to Samba to operate as an AD and Domain Controller.
Then, we proceeded to cover how to have Samba up and running alongside Fedora Linux security features, like having it working with firewalld and SELinux enabled. We did some important testing to make sure everything was fine and ended by showing a bit on how to administrate users using samba-tool.
To summarize, if you want to establish a robust solution for centralizing authentication across your network, servers (If one wanted to, one could even join a Windows 10 client to this Samba domain [tested with Windows 10 Professional version 20H2]) and services, consider using this approach as part of your infrastructure.
Now that you know how to have a Samba as AD and Domain Controller solution, what would you like to see covered next? Share your thoughts in the comments below.
Fedora 33 introduced a new default filesystem in desktop variants, Btrfs. After years of Fedora using ext4 on top of Logical Volume Manager (LVM) volumes, this is a big shift. Changing the default file system requires compelling reasons. While Btrfs is an exciting next-generation file system, ext4 on LVM is well established and stable. This guide aims to explore the high-level features of each and make it easier to choose between Btrfs and LVM-ext4.
In summary
The simplest advice is to stick with the defaults. A fresh Fedora 33 install defaults to Btrfs and upgrading a previous Fedora release continues to use whatever was initially installed, typically LVM-ext4. For an existing Fedora user, the cleanest way to get Btrfs is with a fresh install. However, a fresh install is much more disruptive than a simple upgrade. Unless there is a specific need, this disruption could be unnecessary. The Fedora development team carefully considered both defaults, so be confident with either choice.
What about all the other file systems?
There are a large number of file systems for Linux systems. The number explodes after adding in combinations of volume managers, encryption methods, and storage mechanisms . So why focus on Btrfs and LVM-ext4? For the Fedora audience these two setups are likely to be the most common. Ext4 on top of LVM became the default disk layout in Fedora 11, and ext3 on top of LVM came before that.
Now that Btrfs is the default for Fedora 33, the vast majority of existing users will be looking at whether they should stay where they are or make the jump forward. Faced with a fresh Fedora 33 install, experienced Linux users may wonder whether to use this new file system or fall back to what they are familiar with. So out of the wide field of possible storage options, many Fedora users will wonder how to choose between Btrfs and LVM-ext4.
Commonalities
Despite core differences between the two setups, Btrfs and LVM-ext4 actually have a lot in common. Both are mature and well-tested storage technologies. LVM has been in continuous use since the early days of Fedora Core and ext4 became the default in 2009 with Fedora 11. Btrfs merged into the mainline Linux kernel in 2009 and Facebook uses it widely. SUSE Linux Enterprise 12 made it the default in 2014. So there is plenty of production run time there as well.
Both systems do a great job preventing file system corruption due to unexpected power outages, even though the way they accomplish it is different. Supported configurations include single drive setups as well as spanning multiple devices, and both are capable of creating nearly instant snapshots. A variety of tools exist to help manage either system, both with the command line and graphical interfaces. Either solution works equally well on home desktops and on high-end servers.
The ext4 file system focuses on high-performance and scalability, without a lot of extra frills. It is effective at preventing fragmentation over extended periods of time and provides nice tools for when it does happen. Ext4 is rock solid because it built on the previous ext3 file system, bringing with it all the years of in-system testing and bug fixes.
Most of the advanced capabilities in the LVM-ext4 setup come from LVM itself. LVM sits “below” the file system, which means it supports any file system. Logical volumes (LV) are generic block devices so virtual machines can use them directly. This flexibility allows each logical volume to use the right file system, with the right options, for a variety of situations. This layered approach also honors the Unix philosophy of small tools working together.
The volume group (VG) abstraction from the hardware allows LVM to create flexible logical volumes. Each LV pulls from the same storage pool but has its own configuration. Resizing volumes is a lot easier than resizing physical partitions as there are no limitation of ordered placement of the data. LVM physical volumes (PV) can be any number of partitions and can even move between devices while the system is running.
LVM supports read-only and read-write snapshots, which make it easy to create consistent backups from active systems. Each snapshot has a defined size, and a change to the source or snapshot volume use space from there. Alternately, logical volumes can also be part of a thinly provisioned pool. This allows snapshots to automatically use data from a pool instead of consuming fixed sized chunks defined at volume creation.
Multiple devices with LVM
LVM really shines when there are multiple devices. It has native support for most RAID levels and each logical volume can have a different RAID level. LVM will automatically choose appropriate physical devices for the RAID configuration or the user can specify it directly. Basic RAID support includes data striping for performance (RAID0) and mirroring for redundancy (RAID1). Logical volumes can also use advanced setups like RAID5, RAID6, and RAID10. LVM RAID support is mature because under the hood LVM uses the same device-mapper (dm) and multiple-device (md) kernel support used by mdadm.
Logical volumes can also be cached volumes for systems with both fast and slow drives. A classic example is a combination of SSD and spinning-disk drives. Cached volumes use faster drives for more frequently accessed data (or as a write cache), and the slower drive for bulk data.
The large number of stable features in LVM and the reliable performance of ext4 are a testament to how long they have been in use. Of course, with more features comes complexity. It can be challenging to find the right options for the right feature when configuring LVM. For single drive desktop systems, features of LVM like RAID and cache volumes don’t apply. However, logical volumes are more flexible than physical partitions and snapshots are useful. For normal desktop use, the complexity of LVM can also be a barrier to recovering from issues a typical user might encounter.
Lessons learned from previous generations guided the features built into Btrfs. Unlike ext4, it can directly span multiple devices, so it brings along features typically found only in volume managers. It also has features that are unique in the Linux file system space (ZFS has a similar feature set, but don’t expect it in the Linux kernel).
Key Btrfs features
Perhaps the most important feature is the checksumming of all data. Checksumming, along with copy-on-write, provides the key method of ensuring file system integrity after unexpected power loss. More uniquely, checksumming can detect errors in the data itself. Silent data corruption, sometimes referred to as bitrot, is more common that most people realize. Without active validation, corruption can end up propagating to all available backups. This leaves the user with no valid copies. By transparently checksumming all data, Btrfs is able to immediately detect any such corruption. Enabling the right dup or raid option allows the file system to transparently fix the corruption as well.
Copy-on-write (COW) is also a fundamental feature of Btrfs, as it is critical in providing file system integrity and instant subvolume snapshots. Snapshots automatically share underlying data when created from common subvolumes. Additionally, after-the-fact deduplication uses the same technology to eliminate identical data blocks. Individual files can use COW features by calling cp with the reflink option. Reflink copies are especially useful for copying large files, such as virtual machine images, that tend to have mostly identical data over time.
Btrfs supports spanning multiple devices with no volume manager required. Multiple device support unlocks data mirroring for redundancy and striping for performance. There is also experimental support for more advanced RAID levels, such as RAID5 and RAID6. Unlike standard RAID setups, the Btrfs raid1 option actually allows an odd number of devices. For example, it can use 3 devices, even if they are are different sizes.
All RAID and dup options are specified at the file system level. As a consequence, individual subvolumes cannot use different options. Note that using the RAID1 option with multiple devices means that all data in the volume is available even if one device fails and the checksum feature maintains the integrity of the data itself. That is beyond what current typical RAID setups can provide.
Additional features
Btrfs also enables quick and easy remote backups. Subvolume snapshots can be sent to a remote system for storage. By leveraging the inherent COW meta-data in the file system, these transfers are efficient by only sending incremental changes from previously sent snapshots. User applications such as snapper make it easy to manage these snapshots.
Additionally, a Btrfs volume can have transparent compression and chattr +c will mark individual files or directories for compression. Not only does compression reduce the space consumed by data, but it helps extend the life of SSDs by reducing the volume of write operations. Compression certainly introduces additional CPU overhead, but a lot of options are available to dial in the right trade-offs.
The integration of file system and volume manager functions by Btrfs means that overall maintenance is simpler than LVM-ext4. Certainly this integration comes with less flexibility, but for most desktop, and even server, setups it is more than sufficient.
Btrfs on LVM
Btrfs can convert an ext3/ext4 file system in place. In-place conversion means no data to copy out and then back in. The data blocks themselves are not even modified. As a result, one option for an existing LVM-ext4 systems is to leave LVM in place and simply convert ext4 over to Btrfs. While doable and supported, there are reasons why this isn’t the best option.
Some of the appeal of Btrfs is the easier management that comes with a file system integrated with a volume manager. By running on top of LVM, there is still some other volume manager in play for any system maintenance. Also, LVM setups typically have multiple fixed sized logical volumes with independent file systems. While Btrfs supports multiple volumes in a given computer, many of the nice features expect a single volume with multiple subvolumes. The user is still stuck manually managing fixed sized LVM volumes if each one has an independent Btrfs volume. Though, the ability to shrink mounted Btrfs filesystems does make working with fixed sized volumes less painful. With online shrink there is no need to boot a live image.
The physical locations of logical volumes must be carefully considered when using the multiple device support of Btrfs. To Btrfs, each LV is a separate physical device and if that is not actually the case, then certain data availability features might make the wrong decision. For example, using raid1 for data typically provides protection if a single drive fails. If the actual logical volumes are on the same physical device, then there is no redundancy.
If there is a strong need for some particular LVM feature, such as raw block devices or cached logical volumes, then running Btrfs on top of LVM makes sense. In this configuration, Btrfs still provides most of its advantages such as checksumming and easy sending of incremental snapshots. While LVM has some operational overhead when used, it is no more so with Btrfs than with any other file system.
Wrap up
When trying to choose between Btrfs and LVM-ext4 there is no single right answer. Each user has unique requirements, and the same user may have different systems with different needs. Take a look at the feature set of each configuration, and decide if there is something compelling about one over the other. If not, there is nothing wrong with sticking with the defaults. There are excellent reasons to choose either setup.
Fedora CoreOS is a lightweight, secure operating system optimized for running containerized workloads. A YAML document is all you need to describe the workload you’d like to run on a Fedora CoreOS server.
This is wonderful for a single server, but how would you describe a fleet of cooperating Fedora CoreOS servers? For example, what if you wanted a set of servers running load balancers, others running a database cluster and others running a web application? How can you get them all configured and provisioned? How can you configure them to communicate with each other? This article looks at how Terraform solves this problem.
Getting started
Before you start, decide whether you need to review the basics of Fedora CoreOS. Check out this previous article on the Fedora Magazine:
Terraform is an open source tool for defining and provisioning infrastructure. Terraform defines infrastructure as code in files. It provisions infrastructure by calculating the difference between the desired state in code and observed state and applying changes to remove the difference.
HashiCorp, the company that created and maintains Terraform, offers an RPM repository to install Terraform.
To get yourself familiar with the tools, start with a simple example. You’re going to create a single Fedora CoreOS server in AWS. To follow along, you need to install awscli and have an AWS account. awscli can be installed from the Fedora repositories and configured using the aws configure command
sudo dnf install -y awscli
aws configure
Please note, AWS is a paid service. If executed correctly, participants should expect less than $1 USD in charges, but mistakes may lead to unexpected charges.
Configuring Terraform
In a new directory, create a file named config.yaml. This file will hold the contents of your Fedore CoreOS configuration. The configuration simply adds an SSH key for the core user. Modify theauthorized_ssh_key section to use your own.
Next, create a file main.tf to contain your Terraform specification. Take a look at the contents section by section. It begins with a block to specify the versions of your providers.
Terraform uses providers to control infrastructure. Here it uses the AWS provider to provision EC2 servers, but it can provision any kind of AWS infrastructure. The ct provider from Poseidon Labs stands for config transpiler. This provider will transpile Fedora CoreOS configurations into Ignition configurations. As a result, you do not need to use fcct to transpile your configurations. Now that your provider versions are specified, initialize them.
provider "aws" { region = "us-west-2"
} provider "ct" {}
The AWS region is set to us-west-2 and the ct provider requires no configuration. With the providers configured, you’re ready to define some infrastructure. Use a data source block to read the configuration.
With this data block defined, you can now access the transpiled Ignition output as data.ct_config.config.rendered. To create an EC2 server, use a resource block, and pass the Ignition output as the user_data attribute.
This configuration hard-codes the virtual machine image (AMI) to the latest stable image of Fedora CoreOS in the us-west-2 region at time of writing. If you would like to use a different region or stream, you can discover the correct AMI on the Fedora CoreOS downloads page.
Finally, you’d like to know the public IP address of the server once it’s created. Use an output block to define the outputs to be displayed once Terraform completes its provisioning.
output "instance_ip_addr" { value = aws_instance.server.public_ip
}
Alright! You’re ready to create some infrastructure. To deploy the server simply run:
terraform init # Installs the provider dependencies
terraform apply # Displays the proposed changes and applies them
Oncecompleted, Terraform prints the public IP address of the server, and you can SSH to the server by running ssh core@{public ip here}. Congratulations — you’ve provisioned your first Fedora CoreOS server using Terraform!
Updates and immutability
At this point you can modify the configuration in config.yaml however you like. To deploy your change simply run terraform apply again. Notice that each time you change the configuration, when you run terraform apply it destroys the server and creates a new one. This aligns well with the Fedora CoreOS philosophy: Configuration can only happen once. Want to change that configuration? Create a new server. This can feel pretty alien if you’re accustomed to provisioning your servers once and continuously re-configuring them with tools like Ansible, Puppet or Chef.
The benefit of always creating new servers is that it is significantly easier to test that newly provisioned servers will act as expected. It can be much more difficult to account for all of the possible ways in which updating a system in place may break. Tooling that adheres to this philosophy typically falls under the heading of Immutable Infrastructure. This approach to infrastructure has some of the same benefits seen in functional programming techniques, namely that mutable state is often a source of error.
Using variables
You can use Terraform input variables to parameterize your infrastructure. In the previous example, you might like to parameterize the AWS region or instance type. This would let you deploy several instances of the same configuration with differing parameters. What if you want to parameterize the Fedora CoreOS configuration? Do so using the templatefile function.
As an example, try parameterizing the username of your user. To do this, add a username variable to the main.tf file:
To deploy with username set to jane, run terraform apply -var=”username=jane”. To verify, try to SSH into the server with ssh jane@{public ip address}.
Leveraging the dependency graph
Passing variables from Terraform into Fedora CoreOS configuration is quite useful. But you can go one step further and pass infrastructure data into the server configuration. This is where Terraform and Fedora CoreOS start to really shine.
Terraform creates a dependency graph to model the state of infrastructure and to plan updates. If the output of one resource (e.g the public IP address of a server) is passed as the input of another service (e.g the destination in a firewall rule), Terraform understands that changes in the former require recreating or modifying the later. If you pass infrastructure data into a Fedora CoreOS configuration, it will participate in the dependency graph. Updates to the inputs will trigger creation of a new server with the new configuration.
Consider a system of one load balancer and three web servers as an example.
The goal is to configure the load balancer with the IP address of each web server so that it can forward traffic to them.
Web server configuration
First, create a file web.yaml and add a simple Nginx configuration with a templated message.
Notice the use of count = 3 and the count.index variable. You can use count to make many copies of a resource. Here, it creates three configurations and three web servers. The count.index variable is used to pass the first configuration to the first web server and so on.
Load balancer configuration
The load balancer will be a basic HAProxy load balancer that forwards to each server. Place the configuration in a file named lb.yaml:
The template expects a map with server names as keys and IP addresses as values. You can create that using the zipmap function. Use the ID of the web servers as keys and the public IP addresses as values.
Finally, add an output block to display the IP address of the load balancer.
output "load_balancer_ip" { value = aws_instance.lb.public_ip
}
All right! Run terraform apply and the IP address of the load balancer displays on completion. You should be able to make requests to the load balancer and get responses from each web server.
$ export LB={{load balancer IP here}}
$ curl $LB
<html> <h1>Hello from Server 0</h1>
</html>
$ curl $LB
<html> <h1>Hello from Server 1</h1>
</html>
$ curl $LB
<html> <h1>Hello from Server 2</h1>
</html>
Now you can modify the configuration of the web servers or load balancer. Any changes can be realized by running terraform apply once again. Note in particular that any change to the web server IP addresses will cause Terraform to recreate the load balancer (changing the count from 3 to 4 is a simple test). Hopefully this emphasizes that the load balancer configuration is indeed a part of the Terraform dependency graph.
Clean up
You can destroy all the infrastructure using the terraform destroy command. Simply navigate to the folder where you created main.tf and run terraform destroy.
Where next?
Code for this tutorial can be found at this GitHub repository. Feel free to play with examples and contribute more if you find something you’d love to share with the world. To learn more about all the amazing things Fedora CoreOS can do, dive into the docs or come chat with the community. To learn more about Terraform, you can rummage through the docs, checkout #terraform on freenode, or contribute on GitHub.


 NOTE
NOTE AI Pro 7 ( Ryzen
 LLM output
  Problem Summary
 Likely Root Causes
 Diagnostic Checklist
 Quick‑Fix Path (Try in this order)
 Advanced Debugging (if basic fixes don’t help)
 Bottom Line
 So, time to upgrade.


