Many factors could lead to the error: ‘pip’ is not recognized as an internal or external command. Two of the most common ones are Python’s or pip’s incorrect installation and lacking path in the system environment variables.
This tutorial deeply explains the concept of environment variables, system paths, and pip’s way of storing packages to enable you to track the source of the error comfortably.
It then takes you through a step-by-step way to solve the error. Apart from Windows, you will see how to solve related errors in Linux. What is more? Read on to find out.
❒What Are Environment Variables?
Understanding environment variables is one the most crucial steps to solving pip’s errors.
A computing environment is a platform consisting of the operating system and the processor. On the other hand, a variable is a place for storing a value. The variable can be binary, text, number, filename, or any other data type. It gets its name during creation and can be displayed, updated, and deleted.
The combination of a computing environment and variable is an environment variable, a dynamic value affecting the behavior of a computer process. A computer process is an instance of a program.
# Determine the value of a variable
echo %VARIABLE% # in Windows
echo $VARIABLE # in Linux # display
%VARIABLE% # in Windows
env # command for printing all environment variables OR
printenv # show a single environment variable in Linux.
Features Of Environment Variables
They can be created, read, edited, and deleted.
Each process has its set of environment variables. A newly created process inherits its parent’s same runtime environment.
Environment variables occur in scripts and the command line.
Shell scripts and batch files use environment variables to communicate data and processes to child processes or temporarily store data.
A running process can access the environment variables for configuration reasons.
A collection of environment variables behave like an associative array, with keys and values in strings.
Environment variables may differ depending on the operating system.
Windows stores the default environment variable values in the registry and sets them in the AUTOEXEC.BAT file.
Examples Of Environment Variables
Here are the typical environment variables that interact with pip.
PATH
The path variable lists the directory where your system searches executables. It enables you to view the location of a directory without typing the full path.
In Windows, the path variables are stored in C:\Windows or C:\Windows\System32. In Linux, they originate from the user’s bin or sbin file.
HOME
It shows the default path to the user’s home directory. For instance, HOME//APPDATA stores app settings in Windows. In Linux, the settings are found in HOME/{.App Name}.
In Windows, the misplaced APPDATA lands in the USERPROFILE environment variable, which should instead be used for dialogs to allow a user to choose between folders. LOCALAPPDATA stores local app settings.
TEMP
It stores temporary processes.
Now that you understand how environment variables play a massive in package working, you should find out specific ways to solve pip’s errors.
❒Solution 1: Ensure Pip Is Installed Correctly And Up-to-date
Windows
Pip packages are stored in Python’s installation directory. For instance, installing Python in C:\Python\ stores the default library in C:\Python\Lib\, while the third-party packages reside in C:\Python\Lib\site-packages.
If you install a specific Python version as a stand-alone, pip packages reside in APPDATA.
C:\Users\<username>\AppData\Roaming\Python\Python<version-subversion>\site-packages\ # the version can be 310 for Python 3.10 or 38 for Python 3.8
If you install a pip package that does not use a specific location, it lands in Scripts.
C:\Python310\Scripts\
Pip gets installed by default when you install most Python 3 versions. You can confirm the installation by checking the pip’s version or help command.
pip -V
# OR
pip help
You should get pip’s version version, installation folder, and Python version running it.
pip 22.0.4 from C:\Users\<username>\AppData\Local\Programs\Python\Python310\lib\site-packages\pip (python 3.10)
Otherwise, you could get an error,
'pip' is not recognized as an internal or external command
OR
Python is not recognized as an internal or external command, operable program or batch file.
if you try running python.
python
If you run the above commands without seeing Python, pip, or the installed package, you should download Python.
Install pip as a stand-alone package if pip is still unavailable after installing Python. Download get-pip, and run the following command on the command prompt.
python get-pip.py
Lastly, you can upgrade the pip version and check if the error persists.
python -m pip install --upgrade pip
If the problem is still not solved, try adding Python to the system path variable, as explained in solution 2 of this tutorial.
Linux
The usr is one of the most crucial folders in Linux. It stores information like user binaries, libraries, documentation, and header files. It is where packages that pip manages get installed.
Say we want to install Python 3.10 on Ubuntu 20.04. We can do that by downloading Python from the source or using the deadsnakes custom PPA as follows.
# Update the system, ensuring the required packages are installed.
sudo apt update && sudo apt upgrade -y # Install the required dependency needed to add the custom PPAs.
sudo apt install software-properties-common -y # Add the deadsnakes PPA to the list of APT package manager sources.
sudo add-apt-repository ppa:deadsnakes/ppa # Download Python 3.10
sudo apt install python3.10 # Confirm successful installation
python3.10 --version
The next step is to locate pip.
# pip
pip --version
# OR
pip -V
pip list -v # pip3
pip3 -V
pip list -v
Either way, you may get the following errors.
# pip
Command 'pip' not found, but can be installed with:
sudo apt install python3-pip # pip3
Command 'pip3' not found, but can be installed with:
sudo apt install python3-pip
You get a similar error when you try installing a package.
# pip
pip install django
Command 'pip' not found, but can be installed with:
sudo apt install python3-pip # pip3
pip3 install django
Command 'pip3' not found, but can be installed with:
sudo apt install python3-pip
Let’s install pip.
sudo apt install python3-pip
❒Solution 2: Add The Path Of Pip Installation To The PATH System Variable
You can use the terminal or the GUI.
setx PATH "%PATH%;C:\Python<version-subversion>\Scripts" # For example
setx PATH "%PATH%;C:\Python310\Scripts" # for Python 3.10
To use the GUI,
copy to the full path of the system variable: C:\<username>\steve\AppData\Local\Programs\Python\Python310\Scripts
Type Edit the Environment Variables on the search bar.
On the pop-up window, click on the Advanced tab followed by Environment Variables.
4. You are presented with two boxes. Highlight path on the first box followed by the Edit button below the box.
5. Click on New, paste the script path you had copied earlier, followed by OK on the bottommost part of the screen.
Conclusion
You have learned the leading causes of the error, “‘pip’ is not recognized as an internal or external command,” while installing packages and two typical ways to correct it.
You can check whether your installation was successful and whether the pip is updated and lies in the correct path. Otherwise, you can take the most appropriate step, as explained in this tutorial.
In this article, you’ll learn how to sort a list of tuples by the second value in Python.
To make it more fun, we have the following running scenario:
BridgeTech is a bridge restoration company. They have asked you to sort and return the Top 10 elements from the Periodic Table based on the ‘Atomic Radius’ in descending order.
The atomic radius of a chemical element is a measure of the size of its atom, usually the mean or typical distance from the center of the nucleus to the outermost isolated electron.
Before any data manipulation can occur, one (1) new library will require installation.
The Pandas library enables access to/from a DataFrame.
To install this library, navigate to an IDE terminal. At the command prompt ($), execute the code below. For the terminal used in this example, the command prompt is a dollar sign ($). Your terminal prompt may be different.
$ pip install pandas
Hit the <Enter> key on the keyboard to start the installation process.
If the installation was successful, a message displays in the terminal indicating the same.
Feel free to view the PyCharm installation guide for the required library.
Add the following code to the top of each code snippet. This snippet will allow the code in this article to run error-free.
import numpy as np
from operator import itemgetter
Note: The operator library is built-in to Python and does not require installation.
Method 1: Use Sort and a Lambda
To sort a list of tuples based on the second element, use sort() and lambda in the one-liner expression tups.sort(key=lambda x: x[1], reverse=True).
Here’s an example:
df = pd.read_csv('periodic_table.csv', usecols=['Name', 'AtomicRadius'])
tups = [tuple(x) for x in df.values.tolist()]
tups.sort(key=lambda x: x[1], reverse=True)
print(tups[0:10])
The CSV file is read in preparation, and two (2) columns save to a DataFrame. The DataFrame then converts to a list of tuples (tups) using List Comprehension.
We are ready to sort!
A lambdais passed as a parameter to sort() indicating the sort element (x[1]), and the sort order is set to descending (reverse=True). The results save to tups.
To complete the process, slicing is performed, and the Top 10 elements are sent to the terminal.
To sort a list of tuples by the second element, use the sort() and itemgetter() functions in the expression tuples.sort(key=itemgetter(1), reverse=True).
Here’s an example:
df = pd.read_csv('periodic_table.csv', usecols=['Name', 'AtomicRadius'])
tups = [tuple(x) for x in df.values.tolist()]
tups.sort(key=itemgetter(1), reverse=True)
print(tups[0:10])
The CSV file is read in preparation, and two (2) columns save to a DataFrame. The DataFrame then converts to a List of Tuples (tups) using List Comprehension.
We are ready to sort!
The sort() function passes a key (itemgetter(n)) where n is the sort element (itemgetter(1)), and the sort order is set to descending (reverse=True).
The results save to tups.
To complete the process, slicing is performed, and the Top 10 elements are sent to the terminal.
Note: The itemgetter() function is slightly faster than a lambda. Use itemgetter if speed and memory are a factor.
Method 3: Use Sorted & Lambda
To sort a list of tuples by the second element, combine the functions sorted() and lambda in the expression sorted(tups, key=lambda x:(x[1]), reverse=True) and assign the resulting sorted list to the original variable tups.
Here’s an example:
df = pd.read_csv('periodic_table.csv', usecols=['Name', 'AtomicRadius'])
tups = [tuple(x) for x in df.values.tolist()]
tups = sorted(tups, key=lambda x:(x[1]), reverse=True)
print(tups[0:10])
The CSV file is read in preparation, and two (2) columns save to a DataFrame. The DataFrame then converts to a List of Tuples (tups) using List Comprehension.
We are ready to sort!
A lambdais passed as a parameter to sorted(), indicating the sort element (x[1]), and the sort order is set to descending (reverse=True). The results save to tups.
To complete the process, slicing is performed, and the Top 10 elements are sent to the terminal.
Method 4: Use Bubble Sort
To sort a List of Tuples by the second element, you can also modify a sorting algorithm from scratch such as Bubble Sort to access the second (or n-th) tuple value as a basis for sorting.
Here’s an example:
df = pd.read_csv('periodic_table.csv', usecols=['Name', 'AtomicRadius'])
tups = [tuple(x) for x in df.values.tolist()] def sort_tuples_desc(tups, idx): length = len(tups) for i in range(0, length): for j in range(0, length-i-1): if (tups[j][idx] < tups[j + 1][idx]): tmp = tups[j] tups[j] = tups[j+1] tups[j+1] = tmp return tups
print(sort_tuples_desc(tups, 1)[0:10])
The CSV file is read in preparation, and two (2) columns save to a DataFrame. The DataFrame then converts to a List of Tuples (tups) using List Comprehension.
We are ready to sort!
A sort function sort_tuples_desc is created and passed two (2) parameters: a List of Tuples (tups), and the sort element (idx). Then, the infamous Bubble Sort is performed on the elements.
This function returns a List of Tuples sorted in descending order.
To complete the process, slicing is performed, and the Top 10 elements are sent to the terminal.
Summary
These four (4) methods of sorting a List of Tuples based on the second element should give you enough information to select the best one for your coding requirements.
Problem Statement: How to write a list to a file with Python?
Mostly Python programmers use persistent storage systems like databases or files to store serialized data structures like arrays, lists, and dictionaries. It is because databases and files are reusable, i.e. after analyzing the given data, we can store it in the file, and later that data can be read to use in an application. There are many different ways to write a list to the file in Python. Let’s look at some of them:
Method 1- Using Read And Write
Python facilitates us with standard methods used to read the data from the file and to write the data to a file. While dealing with single lines, we can use the read() and write() methods, respectively. Suppose we have the following list of strings and we have to store each string in a file using Python:
To write the list in to file, we have to follow the steps given below:
Firstly, open the file in write mode by passing the file path and access mode “w” to the open() function.
Next, we have to use the “for” loop to iterate the list. In each iteration, we will get a list item that we need to write in the file using the write() method.
After iterating through the whole list, we need to ensure that we have closed the file. For that, we use the close() method.
Let’s visualize the above demonstration with the help of the following snippet:
# List of colours
colors = ["red", "black", "white", "yellow", "blue"]
# Opening the file in write mode
file = open('colors.txt', 'w')
# Writing the list to the file
for color in colors: file.write(color + '\n')
# Closing the file
file.close()
Output:
red black white yellow blue
Note: The ‘\n‘ character is used for a new line at the end of each item in the list.
Let’s have a look at a situation that demonstrates how we can read the list from the file:
Example:
# Empty list that will read from the file
colors = []
# Opening the file in read mode
with open(r'colors.txt', 'r') as file: for color in file: x = color[:-1] colors.append(x)
print(colors)
While dealing with multiple lines, we have to use the readlines() and writelines() file methods in Python. Hence we can write the entire list into a file using the writelines() method.
Example:
# List of colours
colors = ["red", "black", "white", "yellow", "blue"]
# Opening the file in write mode
with open('colors.txt', 'w') as file: # Writing the entire list to the file file.writelines("\n" % color for color in colors)
Output:
red black white yellow blue
⦿ The following example shows how to use readlines() to read the entire list from a file in Python:
Example:
# Empty list that will read from the file
colors = []
# Opening the file in read mode
with open(r'colors.txt', 'r') as file: colors = [color.rstrip() for color in file.readlines()]
Output:
["red", "black", "white", "yellow", "blue"]
Method 3- Using The Pickle Module
Pickle is a module in Python that is used to serialize or de-serialize an object structure. We can use this module to serialize a list for later use in the same file. The dump() method from the module is used to write the list into a file and it takes the reference of the file and list as its parameters. The method stores the list efficiently as a binary data stream. As it uses a binary stream, the file can even be opened in binary writing mode (wb). Using the module, we can convert any object like a list or dictionary into a character stream. The character stream has the information to reconstruct the object in the future.
Approach: To write a list into the file, we have to first import the pickle module at the start of the program. Then we will use the access mode to open the file. The open() function checks if the file exists or not and if it exists, it gets truncated. The function creates a new one if the file doesn’t already exist. Further, the dump() method converts the object and writes it into the file.
Example:
# Importing the pickle module
import pickle
# Writing the list to the binary file
def writel(a): # Storing the list in binary file (wb) mode with open('file', 'wb') as fp: pickle.dump(colors, fp) print('Completed the process of writing the list into a binary file')
# Reading the list to memory
def readl(): # Reading the list in binary file (rb) mode with open('sample', 'rb') as fp: n = pickle.load(fp) return n
# List of colors
colors = ["red", "black", "white", "yellow", "blue"]
# Calling the writel method
writel(colors)
color = readl()
# Printing the list
print(color)
Output:
Completed the process of writing the list into a binary file ["red", "black", "white", "yellow", "blue"]
Method 4- Using The Json Module
We can use the JSON module to convert the list into a JSON format and then write it into a file using the JSON dump() method. Generally, when we execute a GET request, we will receive a response in JSON format. We can then store the JSON response in a file for any future use.
# Importing the JSON module
import JSON
def writel(a): with open("colors.json", "w") as fp: json.dump(a, fp) print('Completed the process of writing json data into json file')
# Reading the list to memory
def readl(): with open('colors.json', 'rb') as fp: n = json.load(fp) return n
# List of colors
colors = ["red", "black", "white", "yellow", "blue"]
writel(colors)
color = readl()
# Printing the list
print(color)
Output:
Completed the process of writing json data into json file ["red", "black", "white", "yellow", "blue"]
Conclusion
That’s all about how to write a list to a file with Python. I hope you found it helpful. Please stay tuned and subscribefor more interesting articles. Happy learning!
Do you have heavy image files in your application? And do you want to optimize them before pushing them into application directory? This PHP compress image code will help you to optimize images before upload.
The compressed images are scaled down from the original by quality and size. This process makes your media library lightweight and optimized.
This article uses PHP GD functions to implement image compression. It uses the functions imagecreatefromjpeg(), imagejpeg() to resize the images.
We are going to see a quick example and a featured example in PHP to achieve this.
Quick Example
It is a two-step process that this example code performs PHP compress image.
Step 1: imagecreatefromjpeg() gets a resource reference of the source image.
Step 2: imagejpeg() creates the compressed image and outputs it to the browser.
In the second step, it accepts the source image identifier and the target quality. It also accepts the name of the output file in which the compressed version will be.
It has the least possible number of lines shown below.
There are alternative functions under different PHP extensions to implement image compress. The following PHP ImageMagick functions are used to do this.
Imagick::setImageCompression
Imagick::setImageCompressionQuality
Example 2: PHP compress image and upload to the database
This example gives more features on PHP compress image compared to the above code. Some of those features are,
Image upload option via HTML form.
Handling JPEG, GIF and PNG image sources to optimize.
This will be useful for embedding to an application with these additional handlings.
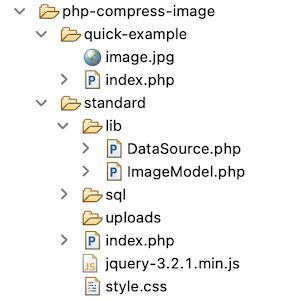
File structure
This screenshot shows the file structure of a simple PHP compress image example. It contains structured files and is easy to understand.
This section describes the steps to set up this example in a development environment.
Step 1: Import database script
Import this SQL script into your database table. It creates a tbl_image table to run this example. It will have the image name and its path on upload.
It also adds the index for primary key settings and auto_increament flag settings.
sql/structure.sql
--
-- Database: `image_upload`
-- --
-- Table structure for table `tbl_image`
-- CREATE TABLE `tbl_image` ( `id` int(11) NOT NULL, `name` varchar(255) NOT NULL, `image` varchar(255) NOT NULL
) ENGINE=InnoDB DEFAULT CHARSET=utf8mb4; --
-- Indexes for dumped tables
-- --
-- Indexes for table `tbl_image`
--
ALTER TABLE `tbl_image` ADD PRIMARY KEY (`id`); --
-- AUTO_INCREMENT for dumped tables
-- --
-- AUTO_INCREMENT for table `tbl_image`
--
ALTER TABLE `tbl_image` MODIFY `id` int(11) NOT NULL AUTO_INCREMENT;
Step 2: Design image upload form
This code displays the HTML form with the option to upload the image. The HTML accept attribute limits the file type to allow only images to choose from.
The form-submit action calls the JavaScript validation. It ensures that the file input is not empty.
It targets the endpoint to optimize images by the compressing process. After a successful PHP compress image process, it shows a preview of the image.
This PHP code is at the beginning of the landing page named index.php. It requests the PHP compress image action once the user submits the form.
First, it calls the compressImage() function to resize. Thereby, it optimizes and stores the image into a folder. Once the image is successfully stored in the folder, then the path will be stored in the database.
This PHP model class has functions to perform the following.
The PHP image insertion function sets a target to place the uploaded image path.
The compressImage() function is used to compress the uploaded file. The main focus of this process is to optimize the image quality.
lib/ImageModel.php
<?php
namespace Phppot; use Phppot\DataSource; class ImageModel
{ private $conn; function __construct() { require_once 'DataSource.php'; $this->conn = new DataSource(); } function getAll() { $query = "SELECT * FROM tbl_image"; $result = $this->conn->select($query); return $result; } function getImageById($id) { $query = "SELECT * FROM tbl_image WHERE id=?"; $paramType = 'i'; $paramValue = array( $id ); $result = $this->conn->select($query, $paramType, $paramValue); return $result; } function insertImage($destination) { $insertId = 0; if (! empty($destination)) { $query = "INSERT INTO tbl_image(name,image) VALUES(?,?)"; $paramType = 'ss'; $paramValue = array( $_FILES["image"]["name"], $destination ); $insertId = $this->conn->insert($query, $paramType, $paramValue); } return $insertId; } function compressImage($sourceFile, $outputFile, $outputQuality) { $imageInfo = getimagesize($sourceFile); if ($imageInfo['mime'] == 'image/gif') { $imageLayer = imagecreatefromgif($sourceFile); } else if ($imageInfo['mime'] == 'image/jpeg') { $imageLayer = imagecreatefromjpeg($sourceFile); } else if ($imageInfo['mime'] == 'image/png') { $imageLayer = imagecreatefrompng($sourceFile); } $response = imagejpeg($imageLayer, $outputFile, $outputQuality); return $response; }
}
?>
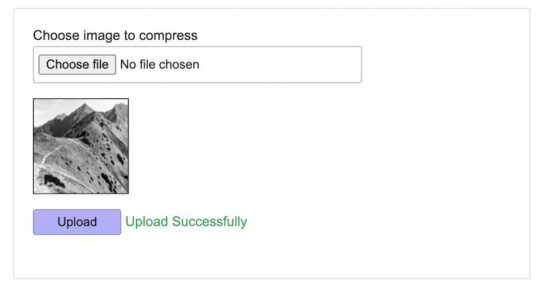
Output: PHP image compress
The below screenshot shows the output of this PHP compress image example. It displays a choose file option to upload an image via an HTML form.
It shows a preview of the uploaded image after form submission.
Use case scenarios that require ‘PHP compress image’
There are some scenarios that need to have media files in optimal quality. In such cases, this PHP compress image utility will be useful to have lightweight images.
Online photo gallery application.
Applications that create and maintain multiple thumbnails for each image.
When the user uploads heavy images that exceed the allowed limit.
Conclusion
I hope, it is useful for you to learn the PHP compress image process. We have seen the purpose and the necessity of this job in a PHP application.
The use case scenarios discussed above justify the importance of having compressed images.
The examples we have seen may help to know the steps to implement. It will make you create your own image file util to do PHP compress image action. Download
In this article, you’ll learn how to count the occurrences of a selected List element in Python.
To make it more fun, we have the following running scenario:
A Teacher from Orchard Elementary would like a script created for the 4th-grade students called “Count-Me“. She would like this script to do the following:
First, generate and display 10 random numbers on a single line.
Next, generate and display one (1) random number to find.
Prompt for the total occurrences found.
Display a message validating the solution.
Question: How would we write the Python code to accomplish this task?
We can accomplish this task by one of the following options:
Before any data manipulation can occur, one (1) new library will require installation.
The NumPy library supports multi-dimensional arrays and matrices in addition to a collection of mathematical functions.
To install this library, navigate to an IDE terminal. At the command prompt ($), execute the code below. For the terminal used in this example, the command prompt is a dollar sign ($). Your terminal prompt may be different.
$ pip install numpy
Hit the <Enter> key on the keyboard to start the installation process.
If the installation was successful, a message displays in the terminal indicating the same.
Feel free to view the PyCharm installation guide for the required library.
Add the following code to the top of each code snippet. This snippet will allow the code in this article to run error-free.
import numpy as np
import random
import operator
from collections import Counter
Note: The counter and collections libraries are built-in to Python and do not require installation.
Method 1: Use NumPy and count()
To count the total occurrences of an element inside a List, this example will use NumPy and the count() function.
the_list = list(np.random.choice(20, 20))
dup_num = the_list[random.randint(0, 19)]
dup_count = the_list.count(dup_num) try: print(the_list) check = int(input(f'How man times does the number {dup_num} appear in the list? ')) if check == dup_count: print(f'Correct! The answer is {check}.') else: print(f'Sorry! Try again!')
except ValueError: print(f'Incorrect value. Bye')
The previous code snippet performs the following steps:
Our first line generates and saves 20 random numbers to the_list.
Next, dup_num is created by generating and saving one (1) random number from the_list.
Finally, we determine how many occurrences of dup_num were found using count().
The result saves to dup_count.
Inside the try statement, the_list is output to the terminal.
The user is prompted to enter the total number of occurrences. To confirm, the user presses the <Enter> key. The value entered is then compared to dup_count, and a message indicates the outcome.
Note: Click here for details on the try/except statement.
Method 2: Use operator countOf()
To count the total occurrences of a specified element inside a List, this example will use the countOf() function.
the_list = [random.randrange(0, 20) for num in range(20)]
dup_num = the_list[random.randint(0, 19)]
dup_count = operator.countOf(the_list, dup_num) try: print(the_list) check = int(input(f'How man times does the number {dup_num} appear in the list? ')) if check == dup_count: print(f'Correct! The answer is {check}.') else: print(f'Sorry! Try again!')
except ValueError: print(f'Incorrect value. Bye')
This code snippet performs the following steps:
Our first line generates and saves 20 random numbers to the_list.
Next, dup_num is created by generating and saving one (1) random number from the_list.
Finally, we determine how many occurrences of dup_num were found using operator.countOf().
The result saves to dup_count.
Inside the try statement, the_list is output to the terminal.
The user is prompted to enter the total number of occurrences. To confirm, the user presses the <Enter> key.
The value entered is then compared to dup_count, and a message indicates the outcome.
Method 3: Use a For Loop
To count the total occurrences of a specified element inside a List, this example will use the For Loop.
the_list = [random.randrange(0, 20) for num in range(20)]
dup_num = the_list[random.randint(0, 19)] dup_count = 0
for i in the_list: if i == dup_num: dup_count += 1 try: print(the_list) check = int(input(f'How man times does the number {dup_num} appear in the list? ')) if check == dup_count: print(f'Correct! The answer is {check}.') else: print(f'Sorry! Try again!')
except ValueError: print(f'Incorrect value. Bye')
The previous code snippet performs the following steps:
Our first line generates and saves 20 random numbers to the_list.
Next, dup_num is created by generating and saving one (1) random number from the_list.
Finally, a For Loop is instantiated. Upon each Loop, the element is matched against dup_num.
If found, dup_count is increased by one (1).
Inside the try statement, the_list is output to the terminal.
The user is prompted to enter the total number of occurrences. To confirm, the user presses the <Enter> key.
The value entered is then compared to dup_count, and a message indicates the outcome.
Method 4: Counter()
To count the total occurrences of a specified element inside a List, this example will use the Counter() initializer method.
the_list = [random.randrange(0, 20) for num in range(20)]
dup_num = the_list[random.randint(0, 19)]
d = Counter(the_list)
dup_count = d[dup_num] try: print(the_list) check = int(input(f'How man times does the number {dup_num} appear in the list? ')) if check == dup_count: print(f'Correct! The answer is {check}.') else: print(f'Sorry! Try again!')
except ValueError: print(f'Incorrect value. Bye')
The previous code snippet performs the following steps:
Our first line generates and saves 20 random numbers to the_list.
Next, dup_num is created by generating and saving one (1) random number from the_list.
Finally, a For Loop is instantiated. Upon each Loop, an element is matched against dup_num.
If found, dup_count is increased by one (1).
Inside the try statement, the_list is output to the terminal.
The user is prompted to enter the total number of occurrences. To confirm, the user presses the <Enter> key.
The value entered is then compared to dup_count, and a message indicates the outcome.
Summary
These four (4) methods of counting occurrences of a specified element inside a List should give you enough information to select the best one for your coding requirements.
You may have already learned how to analyze quantitative data using graphs such as bar charts and histograms.
But do you know how to study textual data?
One way to analyze textual information is by using a word cloud:
Figure 0: Word cloud you’ll learn how to create in this article.
There are many ways to create word clouds, but we will use the WordCloud library in this blog post. WordCloud is a Python library that makes word clouds from text files.
What Are Word Clouds?
Definition: A word cloud (also known as a tag cloud) is a visual representation of the words that appear most frequently in a given text. They can be used to summarize large bodies of text or to visualize the sentiment of a document.
A word cloud is a graphical representation of text data in which the size of each word is proportional to the number of times it appears in the text.
They can be used to visualize the most critical words in a document quickly or to get an overview of the sentiment of a piece of text.
There are word clouds apps such as Wordle, but in this blog post, we will show how to create word clouds using the Python library WordCloud.
What’s the WordCloud Library in Python?
The WordCloud library is open source and easy to use to create word clouds in Python.
It allows you to create word clouds in various formats, including PDF, SVG, and image files.
In addition, it provides several options for customizing your word clouds, including the ability to control the font, color, and layout.
You can install it using the following command in your terminal (without the $ symbol):
Word clouds are a fun and easy way to visualize data.
By displaying the most common words in a given text, they can provide insights into the overall themes and tone of the text.
Word clouds can be used for various purposes, from educational to marketing.
They can use word clouds for vocabulary building and text analysis in the classroom.
You can also use word clouds to generate leads or track customer sentiment.
For businesses, word clouds can be used to create marketing materials, such as blog posts, infographics, and social media content.
Word clouds can also monitor customer feedback or identify negative sentiment.
Students can also use word Clouds to engage in an analysis of a piece of text. By visually highlighting the most important words, Word Clouds can help students to identify the main ideas and make connections between different concepts.
Pros of Word Clouds
The advantages of using word clouds are:
First, you can use them to summarize a large body of text quickly and easily. Identifying the most frequently used words in a text can provide a quick overview of the main points.
Second, with word clouds, you can quickly visualize the sentiment in a document. The size and placement of words in the Word Cloud can give you insights into the overall tone of the document. This tool is handy when analyzing a large body of text, such as customer feedback or reviews.
Third, word clouds can be a valuable tool for identifying the most critical keywords in a text. By analyzing the distribution of words, you can quickly identify which terms are most prominent. The word clouds can be beneficial when monitoring changing trends or assessing the overall importance.
Fourth, word clouds can be used to create designs that incorporate both visual and textual elements. By blending words and images, word clouds can add another layer of meaning to an already exciting design.
How to Create Word Clouds in Python?
We will be using Disneyland reviews downloaded from Kaggle to create a word cloud data visualization.
UnicodeDecodeError: 'utf-8' codec can't decode byte 0xf4 in position 121844: invalid continuation byte
The Unicode decode error means that the string could not be properly decoded into UTF-8. This can happen when a file is downloaded from the Kaggle, and it is not in the correct encoding format.
To solve this problem, you need to specify the encoding format for the file. You can type the following command in a terminal:
The encoding = 'ISO-8859-1' tells pandas that the file is in the ISO-8859-1 encoding format.
Next, create a word cloud using the WordCloud Python library.
wordcloud = WordCloud().generate(['Review_Text'])
In this above code, WordCloud().generate() is used to create a word cloud object.
The generate() function takes a list of strings as input. The list we are interested in is Review_Text which contains reviews about Disney Land. The words from the review you want to appear in your word cloud.
Go ahead and run the code.
You get again following error.
TypeError: expected string or bytes-like object
The type error means that the word cloud object expects a string or a bytes-like object. But the data type is Pandas series.
STOPWORDS will remove all the defined words from the text before creating the word cloud. The word cloud function inserts the STOPWORDS parameter.
Now re-run the program, and you will get the following word cloud image.
Figure 2.
Before we can analyze the words, let us see how to customize the words’ appearance.
You can also customize the appearance of your word cloud by changing the font size and background color.
The maximum font size can be set with the max_font_size option, and the minimum font size can be set with the min_font_size option. The background color of the word cloud can be set with the background_color option.
The above code sets the width and height of the word cloud to 350.
Re-run the program, and you will get the following word cloud image.
Figure 5.
Now let’s analyze the word cloud to get some insights.
The word "ride" appears large in the word cloud as it is the most frequent word in the text. Most people like to ride in Disneyland, which is reflected in the word cloud.
Next, the word "attraction" is also popular. It shows that people are attracted to the rides and attractions in Disneyland.
Also, the word "time" appears frequently. The word indicates that people spend a lot of time in Disneyland.
Staffs of Disney land were very lovely. It is reflected in the word cloud as the word "nice" appears frequently. From the reviews, we can see that there are more queues and people are waiting for a long time, which is also reflected in the word cloud.
The words "lines" and "queue" are also more prominent words in the text.
But the word "hotel" is not popular in the text and represents that people do not prefer to stay in the hotel and go back home after spending the whole day in Disneyland.
Exercise: You can get more insights by analyzing the word cloud data. Try it out!
Summary
Word clouds are a great way to summarize large bodies of text or visualize a document’s sentiment.
Word clouds are a great way to understand large bodies of text and can be used for various purposes.
This blog post showed how to create word clouds using the Python library WordCloud.
We also discussed how to customize the appearance of the word cloud and analyzed the word cloud data to get insights into the text.
The first two arrays x and y of length n contain the (x_i, y_i) data of a 2D coordinate system.
The third array c provides categorical label information so we essentially get n data bundles (x_i, y_i, c_i) for an arbitrary number of categories c_i.
Question: How to plot the data so that (x_i, y_i) and (x_j, y_j) with the same category c_i == c_j have the same color?
Solution: Use Pandas groupby() and Call plt.plot() Separately for Each Group
To plot data by category, you iterate over all groups separately by using the data.groupby() operation. For each group, you execute the plt.plot() operation to plot only the data in the group.
In particular, you perform the following steps:
Use the data.groupby("Category") function assuming that data is a Pandas DataFrame containing the x, y, and category columns for n data points (rows).
Iterate over all (name, group) tuples in the grouping operation result obtained from step one.
Use plt.plot(group["X"], group["Y"], marker="o", linestyle="", label=name) to plot each group separately using the x, y data and name as a label.
Here’s what that looks like in code:
import pandas as pd
import matplotlib.pyplot as plt # Generate the categorical data
x = [1, 2, 3, 4, 5, 6]
y = [42, 41, 40, 39, 38, 37]
c = ['a', 'b', 'a', 'b', 'b', 'a'] data = pd.DataFrame({"X": x, "Y": y, "Category": c})
print(data) # Plot data by category
groups = data.groupby("Category")
for name, group in groups: plt.plot(group["X"], group["Y"], marker="o", linestyle="", label=name) plt.legend()
plt.show()
Before I show you how the resulting plot looks, allow me to show you the data output from the print() function. Here’s the output of the categorical data:
 X Y Category
0 1 42 a
1 2 41 b
2 3 40 a
3 4 39 b
4 5 38 b
5 6 37 a
Now, how does the colored category plot look like? Here’s how:
If you want to learn more about Matplotlib, feel free to check out our full blog tutorial series:
This article will demonstrate how to use a pandas dataframe method called rolling().
What does the pandas.DataFrame.rolling() method do?
In short, it performs rolling windows calculations.
It is often used when working with time-series data or signal processing. I will shortly dive into a few practical examples to clarify what this means in practice.
The method will be given a parameter that specifies how big the window the desired calculations should be performed in.
A simple example of using time series data could be that each row of a pandas dataframe represents a day with some values.
Let’s say that the desired window size is five days. The rolling method is given a five as input, and it will perform the expected calculation based on steps of five days.
Before an example of this, let’s see the method, its syntax, and its parameters.
If an integer, the fixed number of observations is used for each window.
If an offset, the time period of each window. Each window will be variable-sized based on the observations included in the time period. This is only valid for datetime-like indexes.
If a BaseIndexer subclass, the window boundaries are based on the defined get_window_bounds() method. Additional rolling keywords argument, namely min_periods, center, and closed will be passed to get_window_bounds().
min_periods
min_periods: int, default None
This is the minimum number of observations in the window required to have a value.
The data I will be working with for this tutorial is historical data for a stock, the amazon stock.
I use the python package yfinance to import the data. I will use data starting from 2021-04-01 and running one year forward in time.
The data only includes trading days, i.e., days when the stock market was open.
# Get the stock data from Yahoo finance
AmazonData1y = yfinance.Ticker("AMZN").history(period='1y', actions=False, end='2022-04-01')
display(AmazonData1y.head(20))
The resulting dataframe contains data about the opening price, the highest price, the lowest price, the closing price, and the trading volume for each day.
Calculating moving averages
The first calculations using the rolling method I will do are some different moving averages values. They are often applied in stock analysis.
A moving average value is a statistic that captures the average change in a data series over time. (source)
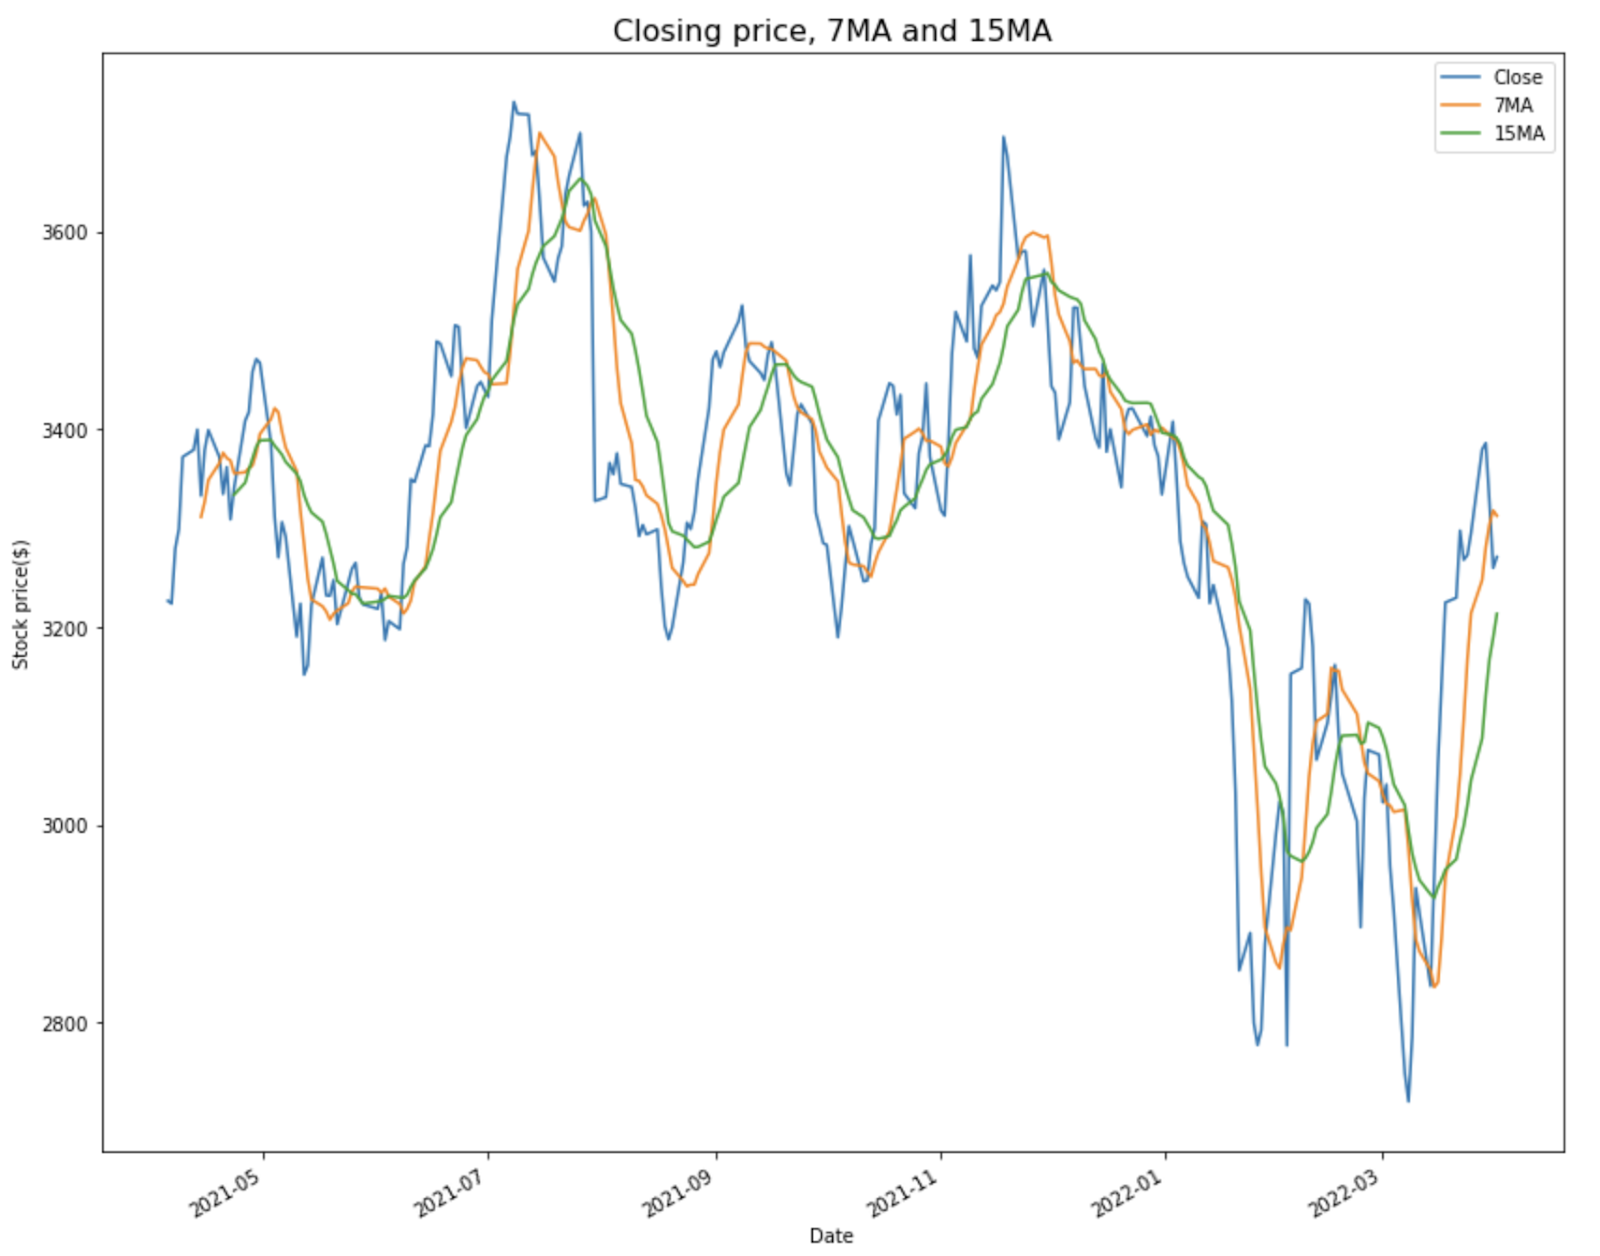
Let’s calculate the moving averages for seven days and 15 days for the stock closing price and add those values as new columns to the existing amazon dataframe.
They are named 'MA7' and 'MA15'.
# Calculating the 7 and 15 day moving averages based on closing price
# and adding them as new columns
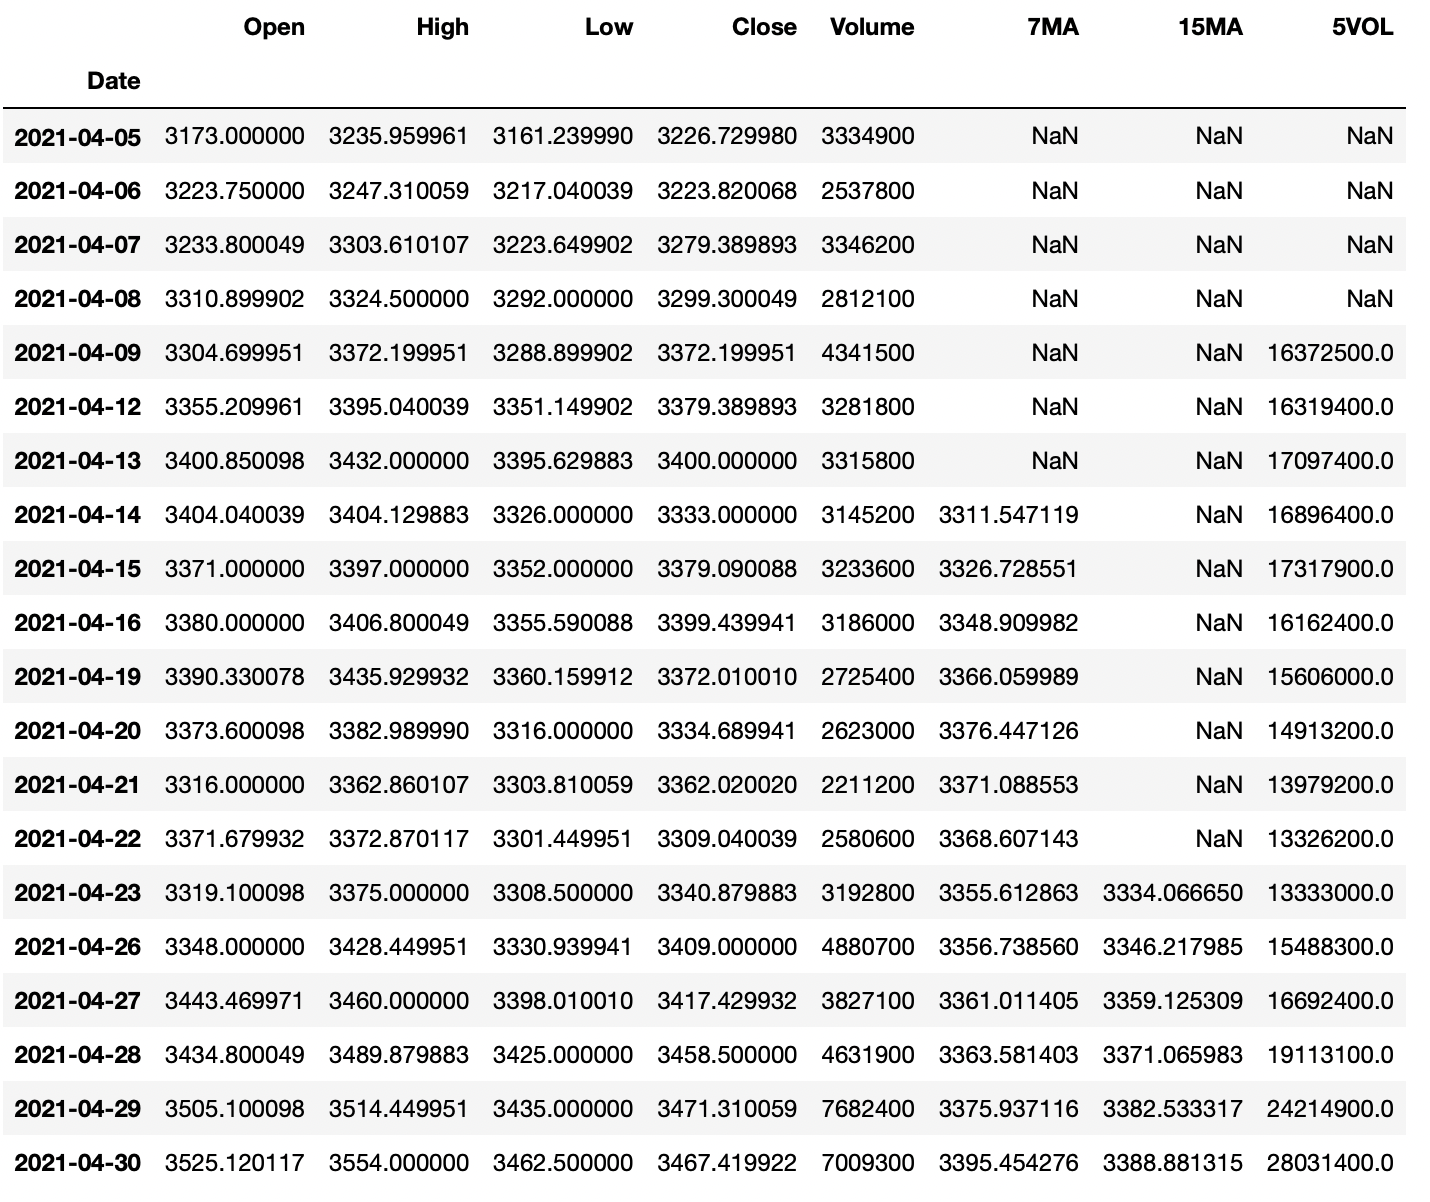
AmazonData1y['7MA'] = AmazonData1y['Close'].rolling(7).mean()
AmazonData1y['15MA'] = AmazonData1y['Close'].rolling(15).mean() display(AmazonData1y.head(20))
Since there is no data before 2021-04-01, no seven-day moving average can be calculated before 2021-04-13 and no 15-day moving average before 2021-04-23.
Calculating the Sum of Trading Volume
Let’s now instead use the rolling method to calculate the sum of the volume from the last five trading days to spot if there was any spike in volume.
It is done in the same way as for the moving average, but here the sum() method is used together with the rolling method instead of the mean() method.
I will also add this as a new column to the existing Amazon dataframe.
# Calculating 5 day volume using rolling
AmazonData1y['5VOL'] = AmazonData1y['Volume'].rolling(5).sum() display(AmazonData1y.head(20))
This metric might not be the most useful but it is a good way to explain how you could use the rolling method together with the sum() method.
Using rolling() with Aggregation
If combining the rolling() method with the aggregation method agg(), it is easy to perform rolling calculations on multiple columns simultaneously.
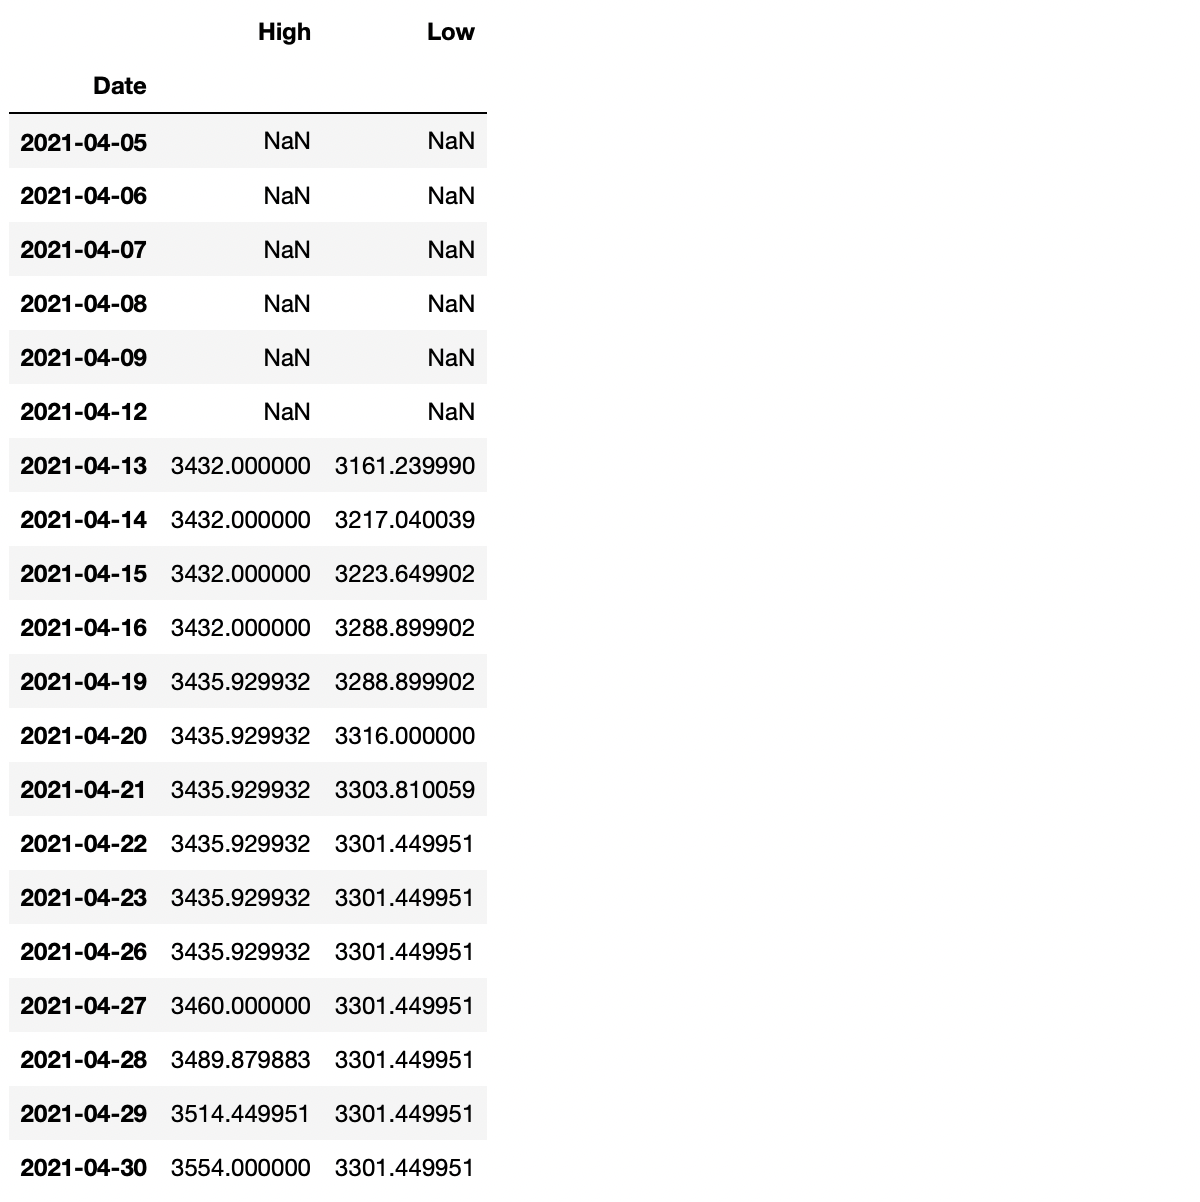
Say that I would like to find the highest high and the lowest low for the last seven days.
# Performing rolling calculations on multiple columns at the
# same time using .agg()
SevenHighAndLow = AmazonData1y.rolling(7).agg({'High': 'max', 'Low': 'min'}) display(SevenHighAndLow.head(20))
Plotting the Values
This part will be included to visualize the value calculated. It’s a bit more appealing than simply just looking at columns of a dataframe.
First, let’s plot the calculated moving averages values alongside the closing price.
# Plotting the closing price with the 7 and 15 day moving averages
AmazonData1y.plot(y=['Close', '7MA', '15MA'], kind='line', figsize=(14,12)) plt.title('Closing price, 7MA and 15MA', fontsize=16)
plt.xlabel('Date')
plt.ylabel('Stock price($)')
plt.show()
And then the accumulated 5 day volume alongside the closing price.
# Plotting the closing price alongside the 5 day volume
AmazonData1y.plot(y=['Close', '5VOL'], secondary_y='5VOL', kind='line', ylabel='Stock Price ($)', figsize=(14,12)) plt.title('Closing price and 5 day accumulated volume', fontsize=16)
plt.xlabel('Date')
plt.ylabel('Volume')
plt.show()
Summary
This was a short tutorial on applying the rolling() method on a pandas dataframe using some statistics.
The goal of this article was to demonstrate some simple examples of how the rolling() method works, and I hope that it did accomplish that goal.
The rolling() method can be used for most statistics calculations, so try and explore it using other methods than those used for this article.
The absolute path (i.e., full path) is just what it sounds like — it’s the exact path to, and location of, the file entered as your function’s parameter, within the hierarchical structure on your machine.
The absolute path always starts at the root directory with no regard for your current working directory (CWD).
That’s it! So let’s get into some code.
Import Python Module to Get Absolute Path
With more than 200 core modules Python can do amazing things.
But, this can also make it seem daunting to the beginner. As we go through this one aspect, it should become much more clear to you how you can navigate your way around and find the specific tool for your project.
I have included some links and examples to help get you started.
We will be using the built-in os module, so we need to import that first.
import os
We could just write the code for the absolute path here and then dissect the output, but I want to give you a deeper look at what’s available to you in Python.
In order to get the absolute path in Python, we first check the output of the dir() statement on the os module:
print(dir(os))
This simple code will give us the directory for the os module.
You can see that it gives us a list of ALL the sub-modules and methods available to us. The 'path' sub-module in the output is the one we use to get the absolute path next.
Next, we combine the os module and the path sub-module to get a directory of the methods and functions we have available.
print(dir(os.path)) # os + .path
(If you are very new to Python, the hash in front of the highlighted section creates a comment)
As we can see, this returns the Absolute Path for the current directory in the Jupyter Notebook that I’m using to write and test my code. It is returned as a string data type.
And finally,the file name entered into the function.
Python Absolute Path vs Relative Path
Now that you understand a bit about absolute path in Python, we should take a look at the relative path, which does take the CWD (current working directory) into consideration.
First let’s get the CWD.
print(os.getcwd())
Output:
'C:\Users\tberr\FinxterProjects1'
We get everything except the file itself, which in this simple example is the relative path.
print(os.path.relpath('Demo_abspath'))
Output:
'Demo_abspath'
So, why not just use the absolute path? As I’ve said, this is a very simple example. When we get into deeply nested directories, the absolute path can get very complicated.
This is where the relative path becomes very useful (and can save you some typing!).
Summary
Use the os.path.abspath() function to get the absolute path without regard to the cwd.
Use os.path.relpath() function to get the relative path to the file with regard to the cwd.
I hope this article was helpful and gave you a beginners introduction to abspath() and the os module in Python. I was hooked on Python my first day. So maybe this will inspire you to dig deeper and explore all the amazing things Python can do – and you’ll be hooked too!
¿Cómo se puede filtrar una lista en Python utilizando una condición arbitraria? La forma más pitónica y más eficiente es utilizar la comprensión de lista[x for x in list if condition] para filtrar todos los elementos de una lista.
Filtrar con comprensión de lista
La forma más pitónica de filtrar una lista, en mi opinión, es la declaración de comprensión de lista [x for x in list if condition]. Puedes sustituir la condición por cualquier función de x que quieras utilizar como condición de filtrado.
Por ejemplo, si quieres filtrar todos los elementos menores de, digamos, 10, utilizarías la declaración de comprensión de lista [x for x in list if x<10] para crear una nueva lista con todos los elementos de la lista menores de 10.
Aquí hay tres ejemplos de filtrado de una lista:
Obtener elementos menores de ocho: [x for x in lst if x<8].
Obtener elementos pares: [x for x in lst if x%2==0].
Obtener elementos impares: [x for x in lst if x%2].
lst = [8, 2, 6, 4, 3, 1] # Filter all elements <8
small = [x for x in lst if x<8]
print(small) # Filter all even elements
even = [x for x in lst if x%2==0]
print(even) # Filter all odd elements
odd = [x for x in lst if x%2]
print(odd)
El resultado es:
# Elements <8
[2, 6, 4, 3, 1] # Even Elements
[8, 2, 6, 4] # Odd Elements
[3, 1]
Esta es la forma más eficiente de filtrar una lista y también la más pitónica. Pero si buscas alternativas, sigue leyendo porque te explicaré todos y cada uno de los matices del filtrado de listas en Python en esta completa guía.
Filtrar una lista en Python con filter()
La función filter(function, iterable) toma como entrada una función que recibe un argumento (un elemento de lista) y devuelve un valor booleano sobre si este elemento de lista debe pasar el filtro. Todos los elementos que pasan el filtro se devuelven como un nuevo objeto iterable (un objeto filter).
Puedes emplear una declaración de función lambda para crear la función justo donde la pasas como argumento. La sintaxis de la función lambda es lambda x: expression y significa que utilizas x como argumento de entrada y devuelves expression como resultado (que puede o no utilizar x para decidir sobre el valor de retorno). Para más información, consulta mi artículo detallado del blog sobre la función lambda.
lst = [8, 2, 6, 4, 3, 1] # Filter all elements <8
small = filter(lambda x: x<8, lst)
print(list(small)) # Filter all even elements
even = filter(lambda x: x%2==0, lst)
print(list(even)) # Filter all odd elements
odd = filter(lambda x: x%2, lst)
print(list(odd))
El resultado es:
# Elements <8
[2, 6, 4, 3, 1] # Even Elements
[8, 2, 6, 4] # Odd Elements
[3, 1]
La función filter() devuelve un objeto filter que es iterable. Para convertirlo en una lista, se utiliza el constructor list(...).
Sólo añado esta opción porque hay gente que aún intenta utilizar la función map() para filtrar elementos de una lista. Está claro que esta es la forma incorrecta de hacerlo. La razón es que la función map() sólo le permite transformar cada elemento de una lista en un nuevo elemento. Pero seguirás teniendo el mismo número de elementos en la lista. Por lo tanto, necesitas un paso adicional para filtrar todos los elementos (por ejemplo, utilizando comprensión de lista). Pero si estás dispuesto a dar este paso adicional, también podrías haber utilizado una comprensión de lista para filtrar desde un principio.
A esto me refiero:
lst = [8, 2, 6, 4, 3, 1] # Filter all elements <8
small = list(map(lambda x: x if x<8 else None, lst))
small = [x for x in small if x!=None]
print(small) # Filter all even elements
even = list(map(lambda x: x if x%2==0 else None, lst))
even = [x for x in even if x!=None]
print(even) # Filter all odd elements
odd = list(map(lambda x: x if x%2 else None, lst))
odd = [x for x in odd if x!=None]
print(odd)
El resultado vuelve a ser el mismo:
[2, 6, 4, 3, 1]
[8, 2, 6, 4]
[3, 1]
Pero el método para obtener este resultado es claramente ineficaz y no resulta legible.
Una expresión generadora crea un iterador sobre una secuencia de valores. Funciona igual que la comprensión de listas, pero sin crear un tipo de datos de lista. Esto es un poco más eficiente.
Puedes utilizar expresiones generadoras en cualquier llamada a una función que requiera un iterable como entrada. Por ejemplo, si quieres calcular la suma de todos los valores que cumplen una determinada condición en una lista.
Primero, determina el iterable de valores que cumplen una determinada condición.
En segundo lugar, suma todos esos valores con la función sum().
Aquí tienes un ejemplo de código que muestra cómo sumar todos los valores enteros de una lista (e ignorar el resto) utilizando una expresión generadora para filtrar los no enteros:
lst = [6, 8, 2, 8, 'Alice']
print(sum(x for x in lst if type(x) == int))
# 24
Comprueba el type(x) de cada elemento y compáralo con el tipo integer. Esta comparación devuelve True si el elemento es, de hecho, de tipo entero.
Filtrar una lista en Python con condición
Puedes definir cualquier condición compleja sobre un elemento de la lista para decidir si se filtra o no. Sólo tienes que crear tu propia función (por ejemplo, condition(x)) que tome un elemento de la lista como entrada y devuelva el valor booleano True si se cumple la condición o False en caso contrario.
Aquí tienes un ejemplo de código:
def condition(x): '''Define your arbitrarily complicated condition here''' return x<10 and x>0 lst = [11, 14, 3, 0, -1, -3] # Filter out all elements that do
# not meet condition
filtered = [x for x in lst if condition(x)]
print(filtered)
# [3]
Todos los elementos que son menores que 10 y mayores que 0 se incluyen en la lista filtrada. Por lo tanto, solo queda el elemento 3.
Filtrar una lista en Python con condiciones múltiples
Lo mismo se aplica si quieres combinar varias condiciones. Digamos que deseas filtrar todos los elementos x>9 y x<1. Estas son dos condiciones (simples). Puedes definir cualquier condición compleja sobre un elemento de la lista para decidir si se filtra o no. Sólo tienes que crear tu propia función (por ejemplo, condition(x)) que tome un elemento de la lista como entrada y devuelva el valor booleano True si se cumple la condición o False en caso contrario.
Aquí está el mismo ejemplo de código que antes:
def condition(x): '''Define your arbitrarily complicated condition here''' return x<10 and x>0 lst = [11, 14, 3, 0, -1, -3] # Filter out all elements that do
# not meet condition
filtered = [x for x in lst if condition(x)]
print(filtered)
# [3]
Todos los elementos que son menores que 10 y mayores que 0 se incluyen en la lista filtrada. Por lo tanto, solo queda el elemento 3.
Filtrar una lista en Python con Regex
Problema: Dada una lista de cadenas. ¿Cómo puedes filtrar aquellas que coincidan con una determinada expresión regular?
Ejemplo: Digamos que tienes una lista ['Alice', 'Anne', 'Ann', 'Tom'] y quieres descartar los elementos que no cumplen el patrón regex 'A.*e'. Esperas que la lista filtrada sea ['Alice', 'Anne'].
Solución: Utiliza el marco de filtrado de comprensión de lista [x for x in list if match] para filtrar todos los elementos que no concuerden con una cadena determinada.
import re # Define the list and the regex pattern to match
customers = ['Alice', 'Anne', 'Ann', 'Tom']
pattern = 'A.*e' # Filter out all elements that match the pattern
filtered = [x for x in customers if re.match(pattern, x)] print(filtered)
# ['Alice', 'Anne']
Utiliza el método re.match() que devuelve un objeto match si hay una coincidencia o None en caso contrario. En Python, cualquier objeto match se evalúa como True (si es necesario), salvo algunas excepciones (por ejemplo, None, 0, 0.0, etc.). Si necesitas refrescar tus conocimientos básicos sobre la función re.match(), echa un vistazo a mi detallado artículo del blog que te lleva paso a paso por esta potente herramienta de Python.
Respuesta corta: Para filtrar una lista de listas por una condición en las listas internas, utiliza la declaración de comprensión de lista [x for x in list if condition(x)] y sustituye condition(x) por tu condición de filtrado que devuelva True para incluir la lista interna x, y False en caso contrario.
Las listas pertenecen a las estructuras de datos más importantes de Python: ¡todo programador experto las conoce a fondo! Sorprendentemente, incluso los programadores intermedios no saben la mejor manera de filtrar una lista, y mucho menos una lista de listas en Python. ¡Este tutorial te muestra cómo hacer esto último!
Problema: Digamos que tienes una lista de listas. Quieres filtrar la lista de listas para que sólo queden las listas interiores que satisfagan una determinada condición. La condición es una función de la lista interna, como la media o la suma de los elementos de la lista interna.
Ejemplo: Dada la siguiente lista de listas con mediciones semanales de temperatura, y una lista interior semanal.
# Measurements of a temperature sensor (7 per week)
temperature = [[10, 8, 9, 12, 13, 7, 8], # week 1 [9, 9, 5, 6, 6, 9, 11], # week 2 [10, 8, 8, 5, 6, 3, 1]] # week 3
¿Cómo filtrar las semanas más frías con un valor medio de temperatura <8? Este es el resultado que deseas:
Problema: Dada una lista de cadenas y una cadena de búsqueda. ¿Cómo puedes filtrar las que contienen la cadena de búsqueda?
Ejemplo: Digamos que tienes una lista ['Alice', 'Anne', 'Ann', 'Tom'] y quieres obtener todos los elementos que contienen la subcadena 'An'. Esperas que la lista filtrada sea ['Anne', 'Ann'].
Solución: Utiliza el esquema de filtrado de comprensión de lista [x for x in list if condition] para descartar todos los elementos que no contengan otra cadena.
import re # Define the list
customers = ['Alice', 'Anne', 'Ann', 'Tom'] # Filter out all elements that contain 'An'
filtered = [x for x in customers if 'An' in x] print(filtered)
# ['Anne', 'Ann']
Utiliza la operación básica de pertenencia a la cadena “in” para comprobar si un elemento pasa el filtro o no.
Filtrar una lista en Python para eliminar cadenas vacías
Problema: Dada una lista de cadenas. ¿Cómo puedes eliminar todas las cadenas vacías?
Ejemplo: Digamos que tienes una lista ['Alice', 'Anne', '', 'Ann', '', 'Tom'] y quieres obtener una nueva lista ['Alice', 'Anne', 'Ann', 'Tom'] de cadenas no vacías.
Solución: Utiliza el esquema de filtrado de comprensión de lista [x for x in list if x] para filtrar todas las cadenas vacías.
import re # Define the list
customers = ['Alice', 'Anne', '', 'Ann', '', 'Tom'] # Filter out all elements that contain 'An'
filtered = [x for x in customers if x] print(filtered)
# ['Alice', 'Anne', 'Ann', 'Tom']
Aprovechas la característica de que Python asigna el valor booleano False a la cadena vacía ''.
Filtrar una lista en Python con endswith() y startswith()
Problema: Dada una lista de cadenas. ¿Cómo puedes filtrar aquellas que comienzan con otra cadena (o terminan con otra cadena)? En otras palabras, deseas obtener todas las cadenas que tienen otra cadena como prefijo o sufijo.
Ejemplo: Digamos que tienes una lista ['Alice', 'Anne', 'Ann', 'Tom'] y quieres obtener todos los elementos que empiezan por 'An'. Esperas que la lista filtrada sea ['Anne', 'Ann'].
Solución: Utiliza el esquema de filtrado de comprensión de lista [x for x in list if x.startswith('An')] para filtrar todos los elementos que empiezan por'An'. Si deseas comprobar cadenas que terminan con otra cadena, puedes usar la función str.endswith() en su lugar.
import re # Define the list
customers = ['Alice', 'Anne', 'Ann', 'Tom'] # Filter out all elements that start with 'An'
filtered = [x for x in customers if x.startswith('An')] print(filtered)
# ['Anne', 'Ann'] # Filter out all elements that end with 'e'
filtered = [x for x in customers if x.endswith('e')] print(filtered)
# ['Alice', 'Anne']
Utiliza las funciones startswith() y endswith() como condiciones de filtrado.
Filtrar una lista en Python con lambda
La función filter(function, iterable) toma como argumento una función de filtrado que toma un elemento de la lista como entrada y devuelve el valor booleano True si se cumple la condición o False en caso contrario. Esta función decide si un elemento se incluye en la lista filtrada o no.
Para definir esta función, puedes utilizar la palabra clave lambda. La función lambda es una función anónima: piensa en ella como una función desechable que sólo se necesita como argumento y para nada más en el código.
Este es el código que muestra cómo utilizar la función lambda para filtrar una lista y devolver sólo los valores impares de la lista:
# Create the list
lst = [1, 2, 3, 4] # Get all odd values
print(list(filter(lambda x: x%2, lst)))
# [1, 3]
La función lambda x: x%2 toma un argumento x -el elemento que hay que comprobar con el filtro- y devuelve el resultado de la expresión x%2. Esta expresión de módulo devuelve 1 si el entero es impar y 0 si es par. Por lo tanto, todos los elementos impares pasan la prueba.
Filtrar una lista en Python con otra lista
Problema: Dada una lista de valores lst y una lista de booleanos filter. ¿Cómo filtrar la primera lista usando la segunda lista? Más específicamente, quieres crear una nueva lista que incluya el i-ésimo elemento de lst si el i-ésimo elemento de filter es True.
Solución: Utiliza una simple declaración de comprensión de lista [lst[i] for i in range(len(lst)) if filter_lst[i]] que compruebe para cada índice i si el valor booleano del filtro correspondiente es True. En este caso, se añade el elemento en el índice i en lst a la nueva lista filtrada. Este es el código:
lst = [1, 2, 3, 4]
filter_lst = [True, False, False, True] res = [lst[i] for i in range(len(lst)) if filter_lst[i]]
print(res)
# [1, 4]
La lista booleana sirve de “máscara” que determina qué elemento pasa el filtro y cuál no.
Una alternativa es usar la función zip() para iterar sobre múltiples secuencias sin necesidad de tocar ningún índice:
lst = [1, 2, 3, 4]
filter_lst = [True, False, False, True] res = [x for (x, boo) in zip(lst, filter_lst) if boo]
print(res)
# [1, 4]
Problema: dada una lista de valores y una lista de índices. ¿Cómo filtrar todos los elementos con índices en la segunda lista?
Ejemplo: Tienes la lista ['Alice', 'Bob', 'Ann', 'Frank'] y los índices [1, 2]. Lo que estás buscando es la lista filtrada ['Bob', 'Ann'].
Solución: Recorre todos los índices de la segunda lista e incluye los elementos correspondientes de la lista mediante una simple sentencia de comprensión de lista [lst[i] for i in indices].
lst = ['Alice', 'Bob', 'Ann', 'Frank']
indices = [1, 2] res = [lst[i] for i in indices]
print(res)
# ['Bob', 'Ann']
Solo dos elementos con índices 1 y 2 pasan el filtro.
Filtrar en Python una lista de diccionarios
Problema: Dada una lista de diccionarios. Cada diccionario consta de uno o más pares (clave, valor). Quieres filtrarlos por el valor de una determinada clave del diccionario (atributo). ¿Cómo puedes lograrlo?
Ejemplo minimalista: Considera el siguiente ejemplo en el que tienes tres diccionarios de usuarios con las claves username, age y play_time. Quieres obtener una lista de todos los usuarios que cumplen una determinada condición, como play_time > 100. Esto es lo que intentas conseguir:
Solución: Utiliza la comprensión de lista[x for x in lst if condition(x)] para crear una nueva lista de diccionarios que cumplan la condición. Todos los diccionarios en lst que no cumplen con la condición se filtran. Puedes definir tu propia condición sobre el elemento x de la lista.
Aquí tienes el código que te muestra cómo filtrar todos los diccionarios de usuario que no cumplen la condición de haber jugado al menos 100 horas.
users = [{'username': 'alice', 'age': 23, 'play_time': 101}, {'username': 'bob', 'age': 31, 'play_time': 88}, {'username': 'ann', 'age': 25, 'play_time': 121},] superplayers = [user for user in users if user['play_time']>100] print(superplayers)
La salida es la lista filtrada de diccionarios que cumplen la condición:
El enfoque ingenuo es revisar cada elemento y verificar si este elemento ya existe en la lista. Si es así, retíralo. Sin embargo, esto requiere unas cuantas líneas de código.
Una forma más corta y concisa es crear un diccionario a partir de los elementos de la lista. Cada elemento de la lista se convierte en una nueva clave del diccionario. Todos los elementos que aparezcan varias veces se asignarán a la misma clave. El diccionario sólo contiene claves únicas, no puede haber varias claves iguales.
Como valores del diccionario, simplemente tomas valores ficticios (por defecto).
Luego, sólo tienes que volver a convertir el diccionario en una lista, desechando los valores ficticios. Como las claves del diccionario permanecen en el mismo orden, no se pierde la información de orden de los elementos de la lista original.
Filtrar todos los elementos de una lista que estén dentro del rango de valores entre los índices de start y stop dados.
lst = [3, 10, 3, 2, 5, 1, 11]
start, stop = 2, 9 filtered_lst = [x for x in lst if x>=start and x<=stop]
print(filtered_lst)
# [3, 3, 2, 5]
Empleas la condición x>=start y x<=stop para comprobar si la lista de elementos x está dentro del rango [start, stop] o no.
Filtrar en Python una lista con mayor que y menor que
Filtrar todos los elementos de una lista que sean mayores que un valor determinado y.
lst = [3, 10, 3, 2, 5, 1, 11]
y = 2 filtered_lst = [x for x in lst if x>y]
print(filtered_lst)
# [3, 10, 3, 5, 11]
Utiliza la condición x > y para comprobar si el elemento de lista x es mayor que y o no. En el primer caso, se incluye en la lista filtrada. En el último, no.
Puedes utilizar la misma idea con el operador menor que< mediante la declaración de comprensión de lista [x for x in lst if x<y].
Recuento de listas filtradas en Python
¿Cómo puedes contar elementos bajo una determinada condición en Python? Por ejemplo, ¿qué pasa si quieres contar todos los valores pares de una lista? ¿O todos los números primos? ¿O todas las cadenas que comienzan con un determinado carácter? Hay múltiples formas de conseguirlo, vamos a discutirlas una por una.
Digamos que tienes una condición para cada elemento x. Convirtámosla en una función con el nombre condition(x). Puedes definir cualquier condición que quieras, sólo tienes que ponerla en tu función. Por ejemplo, esta condición devuelve True para todos los elementos que son mayores que el entero 10:
Pero también puedes definir condiciones más complicadas, como comprobar si son números primos.
Recuento de listas en Python con if
¿Cómo puedes contar los elementos de la lista SI se cumple la condición?
La respuesta es utilizar una simple expresión generadorasum(condition(x) for x in lst):
>>> def condition(x): return x>10 >>> lst = [10, 11, 42, 1, 2, 3]
>>> sum(condition(x) for x in lst)
2
El resultado indica que hay dos elementos que son más grandes que 10. Has utilizado una expresión generadora que devuelve un iterador de booleanos. Ten en cuenta que el booleano True se representa con el valor entero 1 y el booleano False se representa con el valor entero 0. Por eso puedes calcular simplemente la suma de todos los booleanos para obtener el número de elementos para los que se cumple la condición.
Recuento de listas en Python con mayor / menor que
Si quieres determinar el número de elementos que son mayores o menores que un valor especificado, sólo tienes que modificar la condición de este ejemplo:
>>> def condition(x): return x>10 >>> lst = [10, 11, 42, 1, 2, 3]
>>> sum(condition(x) for x in lst)
2
Por ejemplo, para encontrar el número de elementos menores que 5, usa la condición x<5 en la expresión del generador:
>>> lst = [10, 11, 42, 1, 2, 3]
>>> sum(x<5 for x in lst)
3
Recuento de listas en Python de cero / no cero
Para contar el número de ceros en una lista dada, usa la llamada al método list.count(0).
Para contar el número de no-ceros en una lista dada, debes utilizar el recuento condicional, tal y como se comentó anteriormente:
def condition(x): return x!=0 lst = [10, 11, 42, 1, 2, 0, 0, 0]
print(sum(condition(x) for x in lst))
# 5
Recuento de listas en Python con lambda + map
Una alternativa es utilizar una combinación de las funciones map y lambda.
La función lambda devuelve un valor booleano para un elemento dado x.
La función map transforma cada elemento de lista en un valor booleano (1 o 0).
La función sum suma los “1”.
El resultado es el número de elementos para los que la condición se evalúa como True.
Filtrar una lista por longitud de cadena en Python
Dada una lista de cadenas. ¿Cómo obtener todos los elementos que tienen más de x caracteres? En otras palabras: ¿cómo filtrar una lista por longitud de cadena?
coders = ['Ann', 'Alice', 'Frank', 'Pit']
filtered = [x for x in coders if len(x)>3]
print(filtered)
# ['Alice', 'Frank']
La sentencia de comprensión de lista [x for x in coders if len(x)>3] filtra todas las cadenas que tienen más de tres caracteres.
Filtrar los elementos None de una lista en Python
¿Cómo eliminar todos los valores None de una lista? Por ejemplo, tienes la lista ['Alice', None, 'Ann', None, None, 'Bob'] y quieres la lista ['Alice', 'Ann', 'Bob']. ¿Cómo puedes lograrlo?
coders = ['Alice', None, 'Ann', None, None, 'Bob']
filtered = [x for x in coders if x]
print(filtered)
# ['Alice', 'Ann', 'Bob']
En Python, cada elemento tiene un valor booleano asociado, por lo que puede usar cualquier objeto Python como condición. El valor None está asociado al valor booleano False.
Filtrar en Python una lista JSON
Problema: Digamos que tienes un objeto de lista JSON. Quieres filtrar la lista en función de un atributo. ¿Cómo lograrlo?
Solución: Utiliza la comprensión de lista [x for x in json if x['type']=='paid'] para filtrar la lista y obtener una nueva lista json con los objetos que pasan el filtro.
Sólo Ann y Bob tienen una cuenta de pago y pasan el test x['type']=='paid'.
Filtrar en una línea una lista en Python
¿Quieres filtrar tu lista por una condición dada en una línea de código? Utiliza la declaración de comprensión de lista [x for x in list if condition], en la que la parte de la condición puede ser cualquier expresión booleana sobre x. Esta sentencia de una sola línea devuelve un nuevo objeto de lista con todos los elementos que pasan el “test” de filtrado.
Aquí hay un ejemplo:
lst = ['Alice', 3, 5, 'Bob', 10] # ONE-LINER:
f = [x for x in lst if type(x)==str] print(f)
# ['Alice', 'Bob']
La sentencia filtra todos los elementos de la lista y comprueba si son de tipo cadena. Si lo son, pasan la prueba y se incluyen en la nueva lista.
Si te gustan las sentencias de una sola línea, te encantará mi libro Python One-Liner (NoStarch Press 2020). Te muestra exactamente cómo escribir código pitónico y comprimir tu pensamiento y codificación a la forma más minimalista.
Cómo filtrar una lista en Python de forma eficiente: filter() frente a comprensión de lista
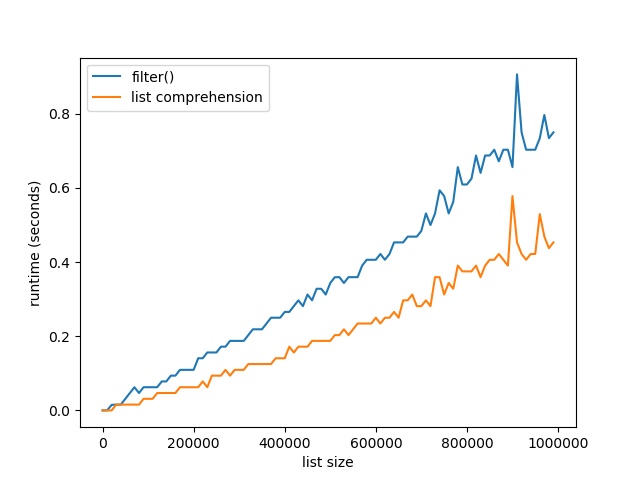
[Spoiler] ¿Qué es más rápido para filtrar una lista: filter() o comprensión de lista? Para listas grandes con un millón de elementos, filtrar listas con comprensión de lista es un 40% más rápido que el método incorporado filter().
Para responder a esta pregunta, he escrito un breve script que comprueba el rendimiento en tiempo de ejecución del filtrado de grandes listas de tamaños crecientes mediante los métodos filter() y de comprensión de lista.
Mi tesis es que el método de comprensión de lista debería ser ligeramente más rápido para los tamaños de lista más grandes, porque aprovecha la eficiente implementación de cPython de la comprensión de lista y no necesita llamar a una función adicional.
Utilicé mi portátil con un procesador Intel(R) Core(TM) i7-8565U a 1,8 GHz (con Turbo Boost hasta 4,6 GHz) y 8 GB de RAM.
A continuación, creé 100 listas con ambos métodos con tamaños que iban de 10.000 elementos a 1.000.000 de elementos. Como elementos, simplemente incrementé los números enteros en uno a partir de 0.
Este es el código que he utilizado para medir y representar los resultados: ¿qué método es más rápido: filter() o una comprensión de lista?
import time # Compare runtime of both methods
list_sizes = [i * 10000 for i in range(100)]
filter_runtimes = []
list_comp_runtimes = [] for size in list_sizes: lst = list(range(size)) # Get time stamps time_0 = time.time() list(filter(lambda x: x%2, lst)) time_1 = time.time() [x for x in lst if x%2] time_2 = time.time() # Calculate runtimes filter_runtimes.append((size, time_1 - time_0)) list_comp_runtimes.append((size, time_2 - time_1)) # Plot everything
import matplotlib.pyplot as plt
import numpy as np f_r = np.array(filter_runtimes)
l_r = np.array(list_comp_runtimes) print(filter_runtimes)
print(list_comp_runtimes) plt.plot(f_r[:,0], f_r[:,1], label='filter()')
plt.plot(l_r[:,0], l_r[:,1], label='list comprehension') plt.xlabel('list size')
plt.ylabel('runtime (seconds)') plt.legend()
plt.savefig('filter_list_comp.jpg')
plt.show()
El código compara los tiempos de ejecución de la función filter() y la variante de comprensión de lista para filtrar una lista. Ten en cuenta que la función filter() devuelve un objeto filter, por lo que debes convertirlo en lista mediante el constructor list().
Aquí está el gráfico resultante que compara el tiempo de ejecución de los dos métodos. En el eje x, puedes ver el tamaño de la lista de 0 a 1.000.000 de elementos. En el eje y, puedes ver el tiempo de ejecución que se necesita en segundos para ejecutar las respectivas funciones.
El gráfico resultante muestra que ambos métodos son extremadamente rápidos para unas decenas de miles de elementos. De hecho, son tan rápidos que la función time() del módulo time no puede capturar el tiempo transcurrido.
Pero a medida que aumentas el tamaño de las listas a cientos de miles de elementos, el método de comprensión de lista empieza a ganar:
Para listas grandes con un millón de elementos, filtrar listas con comprensión de lista es un 40% más rápido que el método incorporado filter().
El motivo es la eficiente implementación de la declaración de comprensión de lista. Sin embargo, es interesante la siguiente observación. Si no conviertes la función filter en una lista, obtendrás el siguiente resultado:
De repente, la función filter() tiene un tiempo de ejecución constante cercano a 0 segundos, independientemente del número de elementos que haya en la lista. ¿Por qué está pasando esto?
La explicación es simple: la función filter devuelve un iterador, no una lista. El iterador no necesita calcular un solo elemento hasta que se le pida que calcule el elemento next(). Por lo tanto, la función filter() calcula el siguiente elemento sólo si es necesario hacerlo. Sólo si lo conviertes en lista, tendrá que computar todos los valores. De lo contrario, no calcula de antemano ningún valor.
A dónde ir desde aquí
Este tutorial te ha mostrado los entresijos de la función filter() en Python y la ha comparado con el método de comprensión de lista para filtrar: [x for x in list if condition]. Has podido comprobar que esto último no sólo es más legible y más pitónico, sino también más rápido. ¡Así que adopta el enfoque de comprensión de lista para filtrar listas!
Si te encanta programar y quieres hacerlo a tiempo completo desde la comodidad de tu propia casa, estás de suerte:
He creado un seminario web gratuito que muestra cómo comencé como freelancer de Python después de mis estudios de informática trabajando desde casa (y viendo crecer a mis hijos) mientras ganaba un ingreso a tiempo completo trabajando solo horas a tiempo parcial.


 Question: How would you write the
  Note: The