Posted on Leave a comment

Why choose the Godot Game Engine over Unity or Unreal Engine

.

This is a very common question, so this guide and video is setting out to answer why *I* might choose to use Godot over those other engines. Keep in mind, this isn’t me saying Godot is better or worse than those engines. Additionally, I have a video on Unreal vs Unity in the works, so if you want to decide which of those engines to use, stay tuned for that.

Without further ado, let’s jump in.

Free

Obviously, the lack of a price tag is one of the most obvious features of Godot. Yes, you can start for free with both Unity and Unreal Engine, but both ultimately have a price tag. With Unity, you pay a per seat license fee if you make over 100K a year. With Unreal Engine you pay a fixed 5% royalty after the first $3000 dollars earned. If you’re not making money nor plan to, this obviously doesn’t matter… but the more successful your game is, the better a deal free is!

Open Source

On the topic of free, we also have free as in freedom. Godot is free in both regards, to price tag and license, being licensed under the MIT license. Unity trails in this regard having only select subsets of the code available. Unreal Engine has the source code available and you can completely build the engine from scratch, as well as being able to fix problems yourself by walking through a debug build and applying fixes.

UE4 however is under a more restrictive proprietary license, while Godot is under the incredibly flexible and permissive code license.

Another aspect in Godot’s favor… it’s also by far the smallest code base and very modular in design from a code perspective. This makes it among the easiest engines to contribute code to. The learning curve to understand the source code is a fraction of that to get started contributing to Unreal, while contributing to Unity is frankly impossible without a very expensive negotiated source license.

Language Flexibility

Over the years Unity have *REMOVED* language support. Once there was UnityScript and Boo, a python like language, in addition to C#. Now it’s pretty much just C# and their in development visual scripting language.

Unreal on the other hand has C++ support, with the C++ thanks to Live++ usable very much like a scripting language (although final build times are by far the worst of all 3 engines!), as well as the (IMHO) single best visual programming language available, Blueprints.

For Godot the options are much more robust. First off there is the Python-lite scripting language, GDScript. You can also use C++, although the workflow for gameplay programming may be suboptimal. Additionally, C# support is being added as a first-class language and there is a visual programming language available here as well, although I can’t really think of a reason to use it as it stands now.

Where Godot really shines though is its modularity. GDScript itself is implemented as a module, meaning making other custom scripting languages is a borderline trivial task, as is extending or customizing GDScript. Additionally, there is GDNative/NativeScript it makes it fairly simple to link to external code, without having to jump into the guts of Godot (nor having to compile Godot) or to write performance critical code in C or C++. Finally, you have the ability to create C++ “modules” that have access to all of the C++ classes available in Godot without having to make changes to the underlying codebase.

Ease of Use

This one is obviously subjective, but if you are looking to create a game, especially as a beginner, the learning curve and ease of use with GDScript make this the easiest of the 3 engines to pick up, at least in my opinion. Unreal Engine is frankly fairly appalling for 2D titles, having basically abandoned Paper2D (their 2D API) on the vine. Over the last couple years Unity have really been focusing heavier on dedicated 2D support, but you still must dig through a lot of cruft and overhead to get to the meat of your game.

With Godot you pretty much everything you need for 2D out of the box and the ability to work directly with pixel (or % based) coordinates.

It’s Tiny

Unreal and Unity are multi GB installs and both have a hub or launcher app. Godot… a 50ish MB zip file (plus templates for a couple hundred more MB needed when deploying). Download, unzip and start game development!

You Like it Better?

You may, or you may not like the coding model of Godot. Chances are if you like the Node based approach to game development, you will love Godot. All three game engines (and almost all modern game engines) take a composition-based approach to scene modeling. Godot takes it one step further, making everything nodes, trees of nodes, even scenes are simply nodes. The approach is different enough that users may either love or hate the approach. If you love the approach Godot takes, you will be productive in it. If you don’t like it, you’re probably better served using Unity or Unreal.

Why Not Pick Godot Then?

I am not even going to pretend that Godot is the perfect game engine and ideal in every situation… there are certainly areas where Unity and Unreal have a small to huge advantage. This could be its own entire video, but a quick list include:

  • Performance concerns, especially on large 3D scenes (hopefully resolved with proper culling and the upcoming Vulkan renderer). In 3D, both engines out perform Godot quite often
  • Platforms… Unity and Unreal support every single platform you can imagine, Godot supports most of the common consumer categories and takes longer to get support for devices like AR/VR. Hardware manufacturers work with Unity and Epic from the design stages, while Godot pretty much must wait for hardware to come to market and then for someone to implement it. Another huge difference, and one of the few downsides to open source software, it isn’t compatible with the closed proprietary licenses of console hardware. While Godot has been ported to run on console hardware, it isn’t supported out of the box and probably never will be.
  • Ecosystem. Godot has a vibrant community but can’t hold a candle to the ecosystem around Unreal and especially Unity. There are simply more users, more books, larger asset stores, etc.
  • The resume factor… this is a part of ecosystem continued. It’s easier to get a job with Unity experience or Unreal experience on the resume than Godot. While many people wouldn’t (and really for a full-time hire, shouldn’t) care what engine you use, when people are hunting for employees, they often look for Unity or UE experience specifically. The other side of this coin is the number of people with Unity or UE experience is larger if you are the one doing the hiring.
  • As with many open source projects, it’s still heavily dependent on one or two key developers. If the leads left the project, it would be a massive blow to the future of Godot. Meanwhile there are hundred or thousands of people being paid to develop Unity or Unreal and the departure of any individual member isn’t likely to have a tangible impact.

The Longer Video Version

[youtube https://www.youtube.com/watch?v=l7BrpcboJno&w=853&h=480]

Programming General


<!–

–>

Posted on Leave a comment

Decoupling microservices with Apache Camel and Debezium

The rise of microservices-oriented architecture brought us new development paradigms and mantras about independent development and decoupling. In such a scenario, we have to deal with a situation where we aim for independence, but we still need to react to state changes in different enterprise domains.

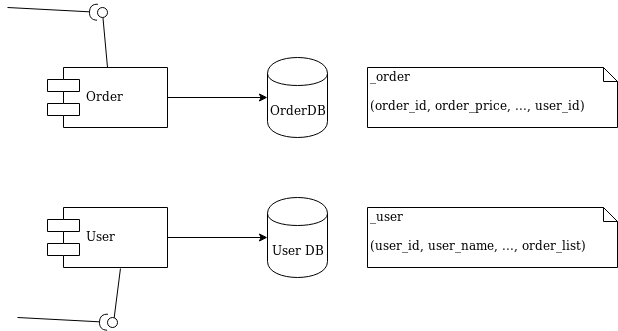
I’ll use a simple and typical example in order to show what we’re talking about. Imagine the development of two independent microservices: Order and User. We designed them to expose a REST interface and to each use a separate database, as shown in Figure 1:

Diagram 1 - Order and User microservices

Figure 1: Order and User microservices.

We must notify the User domain about any change happening in the Order domain. To do this in the example, we need to update the order_list. For this reason, we’ve modeled the User REST service with addOrder and deleteOrder operations.

Solution 1: Queue decoupling

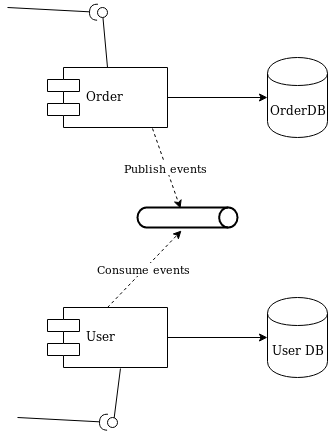
The first solution to consider is adding a queue between the services. Order will publish events that User will eventually process, as shown in Figure 2:

Diagram 2 - decoupling with a queue

Figure 2: Decoupling with a queue.

This is a fair design. However, if you don’t use the right middleware you will mix a lot of infrastructure code into your domain logic. Now that you have queues, you must develop producer and consumer logic. You also have to take care of transactions. The problem is to make sure that every event ends up correctly in both the Order database and in the queue.

Solution 2: Change data capture decoupling

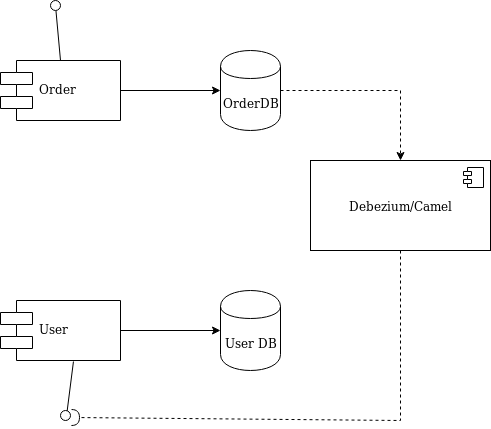
Let me introduce an alternative solution that handles all of that work without your touching any line of your microservices code. I’ll use Debezium and Apache Camel to capture data changes on Order and trigger certain actions on User. Debezium is a log-based data change capture middleware. Camel is an integration framework that simplifies the integration between a source (Order) and a destination (User), as shown in Figure 3:

Diagram 3 - decoupling with Debezium and Camel

Figure 3: Decoupling with Debezium and Camel.

Debezium is in charge of capturing any data change happening in the Order domain and publishing it to a topic. Then a Camel consumer can pick that event and make a REST call to the User API to perform the necessary action expected by its domain (in our simple case, update the list).

Decoupling with Debezium and Camel

I’ve prepared a simple demo with all of the components we need to run the example above. You can find this demo in this GitHub repo. The only part we need to develop is represented by the following source code:

public class MyRouteBuilder extends RouteBuilder { public void configure() { from("debezium:mysql?name=my-sql-connector" + "&databaseServerId=1" + "&databaseHostName=localhost" + "&databaseUser=debezium" + "&databasePassword=dbz" + "&databaseServerName=my-app-connector" + "&databaseHistoryFileName=/tmp/dbhistory.dat" + "&databaseWhitelist=debezium" + "&tableWhitelist=debezium._order" + "&offsetStorageFileName=/tmp/offset.dat") .choice() .when(header(DebeziumConstants.HEADER_OPERATION).isEqualTo("c")) .process(new AfterStructToOrderTranslator()) .to("rest-swagger:http://localhost:8082/v2/api-docs#addOrderUsingPOST") .when(header(DebeziumConstants.HEADER_OPERATION).isEqualTo("d")) .process(new BeforeStructToOrderTranslator()) .to("rest-swagger:http://localhost:8082/v2/api-docs#deleteOrderUsingDELETE") .log("Response : ${body}"); } } 

That’s it. Really. We don’t need anything else.

Apache Camel has a Debezium component that can hook up a MySQL database and use Debezium embedded engine. The source endpoint configuration provides the parameters needed by Debezium to note any change happening in the debezium._order table. Debezium streams the events according to a JSON-defined format, so you know what kind of information to expect. For each event, you will get the information as it was before and after the event occurs, plus a few useful pieces of meta-information.

Thanks to Camel’s content-based router, we can either call the addOrderUsingPOST or deleteOrderUsingDELETE operation. You only have to develop a message translator that can convert the message coming from Debezium:

public class AfterStructToOrderTranslator implements Processor { private static final String EXPECTED_BODY_FORMAT = "{\"userId\":%d,\"orderId\":%d}"; public void process(Exchange exchange) throws Exception { final Map value = exchange.getMessage().getBody(Map.class); // Convert and set body int userId = (int) value.get("user_id"); int orderId = (int) value.get("order_id"); exchange.getIn().setHeader("userId", userId); exchange.getIn().setHeader("orderId", orderId); exchange.getIn().setBody(String.format(EXPECTED_BODY_FORMAT, userId, orderId)); } } 

Notice that we did not touch any of the base code for Order or User. Now, turn off the Debezium process to simulate downtime. You will see that it can recover all events as soon as it turns back on!

You can run the example provided by following the instructions on this GitHub repo.

Caveat

The example illustrated here uses Debezium’s embedded mode. For more consistent solutions, consider using the Kafka connect mode instead, or tuning the embedded engine accordingly.

Share

The post Decoupling microservices with Apache Camel and Debezium appeared first on Red Hat Developer.

Posted on Leave a comment

gRPC vs HTTP APIs

Avatar

James

ASP.NET Core now enables developers to build gRPC services. gRPC is an opinionated contract-first remote procedure call framework, with a focus on performance and developer productivity. gRPC integrates with ASP.NET Core 3.0, so you can use your existing ASP.NET Core logging, configuration, authentication patterns to build new gRPC services.

This blog post compares gRPC to JSON HTTP APIs, discusses gRPC’s strengths and weaknesses, and when you could use gRPC to build your apps.

gRPC strengths

Developer productivity

With gRPC services, a client application can directly call methods on a server app on a different machine as if it was a local object. gRPC is based around the idea of defining a service, specifying the methods that can be called remotely with their parameters and return types. The server implements this interface and runs a gRPC server to handle client calls. On the client, a strongly-typed gRPC client is available that provides the same methods as the server.

gRPC is able to achieve this through first-class support for code generation. A core file to gRPC development is the .proto file, which defines the contract of gRPC services and messages using Protobuf interface definition language (IDL):

Greet.proto

// The greeting service definition.
service Greeter { // Sends a greeting rpc SayHello (HelloRequest) returns (HelloReply);
} // The request message containing the user's name.
message HelloRequest { string name = 1;
} // The response message containing the greetings
message HelloReply { string message = 1;
}

Protobuf IDL is a language neutral syntax, so it can be shared between gRPC services and clients implemented in different languages. gRPC frameworks use the .proto file to code generate a service base class, messages, and a complete client. Using the generated strongly-typed Greeter client to call the service:

Program.cs

var channel = GrpcChannel.ForAddress("https://localhost:5001")
var client = new Greeter.GreeterClient(channel); var reply = await client.SayHelloAsync(new HelloRequest { Name = "World" });
Console.WriteLine("Greeting: " + reply.Message);

By sharing the .proto file between the server and client, messages and client code can be generated from end to end. Code generation of the client eliminates duplication of messages on the client and server, and creates a strongly-typed client for you. Not having to write a client saves significant development time in applications with many services.

Performance

gRPC messages are serialized using Protobuf, an efficient binary message format. Protobuf serializes very quickly on the server and client. Protobuf serialization results in small message payloads, important in limited bandwidth scenarios like mobile apps.

gRPC requires HTTP/2, a major revision of HTTP that provides significant performance benefits over HTTP 1.x:

  • Binary framing and compression. HTTP/2 protocol is compact and efficient both in sending and receiving.
  • Multiplexing of multiple HTTP/2 calls over a single TCP connection. Multiplexing eliminates head-of-line blocking at the application layer.

Real-time services

HTTP/2 provides a foundation for long-lived, real-time communication streams. gRPC provides first-class support for streaming through HTTP/2.

A gRPC service supports all streaming combinations:

  • Unary (no streaming)
  • Server to client streaming
  • Client to server streaming
  • Bidirectional streaming

Note that the concept of broadcasting a message out to multiple connections doesn’t exist natively in gRPC. For example, in a chat room where new chat messages should be sent to all clients in the chat room, each gRPC call is required to individually stream new chat messages to the client. SignalR is a useful framework for this scenario. SignalR has the concept of persistent connections and built-in support for broadcasting messages.

Deadline/timeouts and cancellation

gRPC allows clients to specify how long they are willing to wait for an RPC to complete. The deadline is sent to the server, and the server can decide what action to take if it exceeds the deadline. For example, the server might cancel in-progress gRPC/HTTP/database requests on timeout.

Propagating the deadline and cancellation through child gRPC calls helps enforce resource usage limits.

gRPC weaknesses

Limited browser support

gRPC has excellent cross-platform support! gRPC implementations are available for every programming language in common usage today. However one place you can’t call a gRPC service from is a browser. gRPC heavily uses HTTP/2 features and no browser provides the level of control required over web requests to support a gRPC client. For example, browsers do not allow a caller to require that HTTP/2 be used, or provide access to underlying HTTP/2 frames.

gRPC-Web is an additional technology from the gRPC team that provides limited gRPC support in the browser. gRPC-Web consists of two parts: a JavaScript client that supports all modern browsers, and a gRPC-Web proxy on the server. The gRPC-Web client calls the proxy and the proxy will forward on the gRPC requests to the gRPC server.

Not all of gRPC’s features are supported by gRPC-Web. Client and bidirectional streaming isn’t supported, and there is limited support for server streaming.

Not human readable

HTTP API requests using JSON are sent as text and can be read and created by humans.

gRPC messages are encoded with Protobuf by default. While Protobuf is efficient to send and receive, its binary format isn’t human readable. Protobuf requires the message’s interface description specified in the .proto file to properly deserialize. Additional tooling is required to analyze Protobuf payloads on the wire and to compose requests by hand.

Features such as server reflection and the gRPC command line tool exist to assist with binary Protobuf messages. Also, Protobuf messages support conversion to and from JSON. The built-in JSON conversion provides an efficient way to convert Protobuf messages to and from human readable form when debugging.

gRPC recommended scenarios

gRPC is well suited to the following scenarios:

  • Microservices – gRPC is designed for low latency and high throughput communication. gRPC is great for lightweight microservices where efficiency is critical.
  • Point-to-point real-time communication – gRPC has excellent support for bidirectional streaming. gRPC services can push messages in real-time without polling.
  • Polyglot environments – gRPC tooling supports all popular development languages, making gRPC a good choice for multi-language environments.
  • Network constrained environments – gRPC messages are serialized with Protobuf, a lightweight message format. A gRPC message is always smaller than an equivalent JSON message.

Conclusion

gRPC is a powerful new tool for ASP.NET Core developers. While gRPC is not a complete replacement for HTTP APIs, it offers improved productivity and performance benefits in some scenarios.

gRPC on ASP.NET Core is available now! If you are interested in learning more about gRPC, check out these resources:

Avatar

Posted on Leave a comment

How Quarkus brings imperative and reactive programming together

The supersonic subatomic Java singularity has expanded!

42 releases, 8 months of community participation, and 177 amazing contributors led up to the release of Quarkus 1.0.  This release is a significant milestone with a lot of cool features behind it. You can read more in the release announcement.

Building on that awesome news, we want to delve into how Quarkus unifies both imperative and reactive programming models and its reactive core. We’ll start with a brief history and then take a deep dive into what makes up this dual-faceted reactive core and how Java developers can take advantage of it.

Microservices, event-driven architectures, and serverless functions are on the rise. Creating a cloud-native architecture has become more accessible in the recent past; however, challenges remain, especially for Java developers. Serverless functions and microservices need faster startup times, consume less memory, and above all offer developer joy. Java, in that regard, has just in recent years done some improvements (e.g., ergonomics enhancements for containers, etc.). However, to have a performing container-native Java, it hasn’t been easy. Let’s first take a look at some of the inherent issues for developing container-native Java applications.

Let’s start with a bit of history.

Threads CPUs Java and Containers

Threads and containers

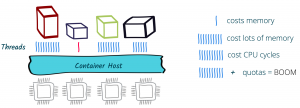
As of version 8u131, Java is more container-aware, due to the ergonomics enhancements. So now, the JVM knows the number of cores it’s running on and can customize thread pools accordingly — typically the fork/join pool. That’s all great, but let’s say we have a traditional web application that uses HTTP servlets or similar on Tomcat, Jetty, or the like. In effect, this application gives a thread to each request allowing it to block this thread when waiting for IO to occur, such as accessing databases, files, or other services. The sizing for such an application depends on the number of concurrent requests rather than the number of available cores; this also means quota or limits in Kubernetes on the number of cores will not be of great help and eventually will result in throttling.

Memory exhaustion

Threads also cost memory. Memory constraints inside a container do not necessarily help. Spreading that over multiple applications and threading to a large extent will cause more switching and, in some cases, performance degradation. Also, if an application uses traditional microservices frameworks, creates database connections, uses caching, and perhaps needs some more memory, then straightaway one would also need to look into the JVM memory management so that it’s not getting killed (e.g., XX:+UseCGroupMemoryLimitForHeap). Even though JVM can understand cgroups as of Java 9 and adapt memory accordingly, it can still get quite complex to manage and size the memory.

Quotas and limits

With Java 11, we now have the support for CPU quotas (e.g., PreferContainerQuotaForCPUCount). Kubernetes also provides support for limits and quotas. This could make sense; however, if the application uses more than the quota again, we end up with sizing based on cores, which in the case of traditional Java applications, using one thread per request, is not helpful at all.

Also, if we were to use quotas and limits or the scale-out feature of the underlying Kubernetes platform, the problem wouldn’t solve itself; we would be throwing more capacity at the underlying issue or end up over-committing resources. And if we were running this on a high load in a public cloud, certainly we would end up using more resources than necessary.

What can solve this?

A straightforward solution to these problems would be to use asynchronous and non-blocking IO libraries and frameworks like Netty, Vert.x, or Akka. They are more useful in containers due to their reactive nature. By embracing non-blocking IO, the same thread can handle multiple concurrent requests. While a request processing is waiting for some IO, the thread is released and so can be used to handle another request. When the IO response required by the first request is finally received, processing of the first request can continue. Interleaving request processing using the same thread reduces the number of threads drastically and also resources to handle the load.

With non-blocking IO, the number of cores becomes the essential setting as it defines the number of IO threads you can run in parallel. Used properly, it efficient dispatches the load on the different cores, handling more with fewer resources.

Is that all?

And, there’s more. Reactive programming improves resource usage but does not come for free. It requires that the application code embrace non-blocking and avoid blocking the IO thread. This is a different development and execution model. Although there are many libraries to help you do this, it’s still a mind-shift.

First, you need to learn how to write code executed asynchronously because, as soon as you start using non-blocking IOs, you need to express what is going to happen once the response is received. You cannot wait and block anymore. To do this, you can pass callbacks, use reactive programming, or continuation. But, that’s not all, you need to use non-blocking IOs and so have access to non-blocking servers and clients for everything you need. HTTP is the simple case, but think about database access, file systems, and so on.

Although end-to-end reactive provides the best efficiency, the shift can be hard to comprehend. Having the ability to mix both reactive and imperative code is becoming essential to:

  1. Use efficiently the resources on hot paths, and
  2. Provide a simpler code style for the rest of the application.

Enter Quarkus

This is what Quarkus is all about: unifying reactive and imperative in a single runtime.

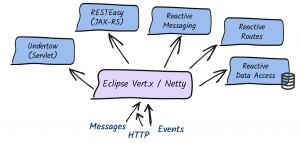
Quarkus uses Vert.x and Netty at its core. And, it uses a bunch of reactive frameworks and extensions on top to help developers. Quarkus is not just for HTTP microservices, but also for event-driven architecture. Its reactive nature makes it very efficient when dealing with messages (e.g., Apache Kafka or AMQP).

The secret behind this is to use a single reactive engine for both imperative and reactive code.

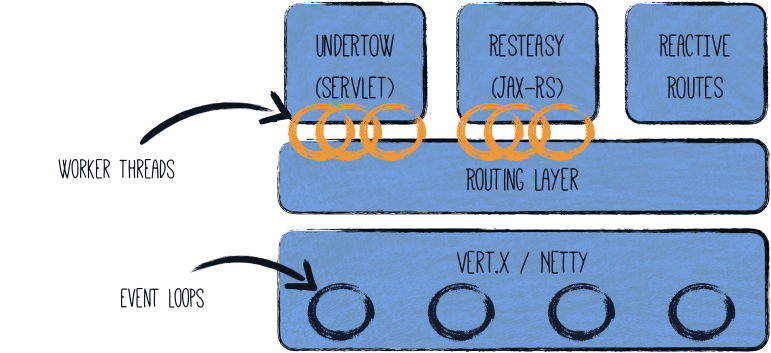
Quarkus does this quite brilliantly. Between imperative and reactive, the obvious choice is to have a reactive core. What that helps with is a fast non-blocking code that handles almost everything going via the event-loop thread (IO thread). But, if you were creating a typical REST application or a client-side application, Quarkus also gives you the imperative programming model. For example, Quarkus HTTP support is based on a non-blocking and reactive engine (Eclipse Vert.x and Netty). All the HTTP requests your application receive are handled by event loops (IO Thread) and then are routed towards the code that manages the request. Depending on the destination, it can invoke the code managing the request on a worker thread (servlet, Jax-RS) or use the IO was thread (reactive route).

For messaging connectors, non-blocking clients are used and run on top of the Vert.x engine. So, you can efficiently send, receive, and process messages from various messaging middleware.

To help you get started with reactive on Quarkus, there are some well-articulated guides on Quarkus.io:

There are also reactive demo scenarios that you can try online; you don’t need a computer or an IDE, just give it a go in your browser. You can try them out here.

Additional resources

Share

The post How Quarkus brings imperative and reactive programming together appeared first on Red Hat Developer.

Posted on Leave a comment

ASP.NET Core updates in .NET Core 3.1 Preview 3

Avatar

Sourabh

.NET Core 3.1 Preview 3 is now available. This release is primarily focused on bug fixes.

See the release notes for additional details and known issues.

Get started

To get started with ASP.NET Core in .NET Core 3.1 Preview 3 install the .NET Core 3.1 Preview 3 SDK.

If you’re on Windows using Visual Studio, for the best experience we recommend installing the latest preview of Visual Studio 2019 16.4. Installing Visual Studio 2019 16.4 will also install .NET Core 3.1 Preview 3, so you don’t need to separately install it. For Blazor development with .NET Core 3.1, Visual Studio 2019 16.4 is required.

Alongside this .NET Core 3.1 Preview 3 release, we’ve also released a Blazor WebAssembly update. To install the latest Blazor WebAssembly template also run the following command:

dotnet new -i Microsoft.AspNetCore.Blazor.Templates::3.1.0-preview3.19555.2

Upgrade an existing project

To upgrade an existing ASP.NET Core 3.1 Preview 2 project to 3.1 Preview 3:

  • Update all Microsoft.AspNetCore.* package references to 3.1.0-preview3.19555.2

See also the full list of breaking changes in ASP.NET Core 3.1.

That’s it! You should now be all set to use .NET Core 3.1 Preview 3!

Give feedback

We hope you enjoy the new features in this preview release of ASP.NET Core! Please let us know what you think by filing issues on GitHub.

Thanks for trying out ASP.NET Core!

Avatar

Posted on Leave a comment

Open Liberty Java runtime now available to Red Hat Runtimes subscribers

Open Liberty is a lightweight, production-ready Java runtime for containerizing and deploying microservices to the cloud, and is now available as part of a Red Hat Runtimes subscription. If you are a Red Hat Runtimes subscriber, you can write your Eclipse MicroProfile and Jakarta EE apps on Open Liberty and then run them in containers on Red Hat OpenShift, with commercial support from Red Hat and IBM.

Develop cloud-native Java microservices

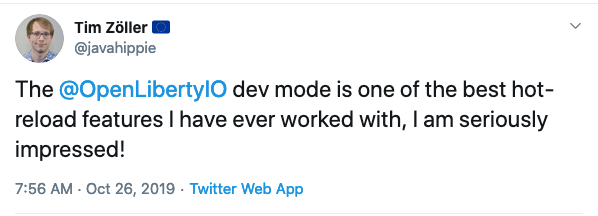
Open Liberty is designed to provide a smooth developer experience with a one-second startup time, a low memory footprint, and our new dev mode:

Tweet about Open Liberty Dev Mode.

Open Liberty provides a full implementation of MicroProfile 3 and Jakarta EE 8. MicroProfile is a collaborative project between multiple vendors (including Red Hat and IBM) and the Java community that aims to optimize enterprise Java for writing microservices. With a four-week release schedule, Liberty usually has the latest MicroProfile release available soon after the spec is published.

Also, Open Liberty is supported in common developer tools, including VS Code, Eclipse, Maven, and Gradle. Server configuration (e.g., adding or removing a capability, or “feature,” to your app) is through an XML file. Open Liberty’s zero migration policy means that you can focus on what’s important (writing your app!) and not have to worry about APIs changing under you.

Deploy in containers to any cloud

When you’re ready to deploy your app, you can just containerize it and deploy it to OpenShift. The zero migration principle means that new versions of Open Liberty features will not break your app, and you can control which version of the feature your app uses.

Monitoring live microservices is enabled by MicroProfile Metrics, Health, and OpenTracing, which add observability to your apps. The emitted metrics from your apps and from the Open Liberty runtime can be consolidated using Prometheus and presented in Grafana.

Learn with the Open Liberty developer guides

Our Open Liberty developer guides are available with runnable code and explanations to help you learn how to write microservices with MicroProfile and Jakarta EE, and then to deploy them to Red Hat OpenShift.

Get started

To get started with Open Liberty, try the Packaging and deploying applications guide and the Deploying microservices to OpenShift guide.

Share

The post Open Liberty Java runtime now available to Red Hat Runtimes subscribers appeared first on Red Hat Developer.

Posted on Leave a comment

Improvements in .NET Core 3.0 for troubleshooting and monitoring distributed apps

Avatar

Sourabh

Post was authored by Sergey Kanzhelev. Thank you David Fowler and Richard Lander for reviews.

Introduction

Operating distributed apps is hard. Distributed apps typically consists of multiple components. These components may be owned and operated by different teams. Every interaction with an app results in distributed trace of code executions across many components. If your customer experiences a problem – pinpointing the root cause in one of components participated in a distributed trace is a hard task.

One big difference of distributed apps comparing to monoliths is a difficulty to correlate telemetry (like logs) across a single distributed trace. Looking at logs you can see how each component processed each request. But it is hard to know which request in once component and request in other component belong to the same distributed trace.

Historically, Application Performance Monitoring (APM) vendors provided the functionality of distributed trace context propagation from one component to another. Telemetry is correlated using this context. Due to heterogeneous nature of many environments, with components owned by different teams and using different tools for monitoring, it was always hard to instrument distributed apps consistently. APM vendors provided automatic code injection agents and SDKs to handle complexity of understanding various distributed context formats and RPC protocols.

With the upcoming transition of W3C Trace Context specification into Proposed Recommendation maturity level, and support of this specification by many vendors and platforms, the complexity of the context propagation is decreasing. The W3C Trace Context specification describes semantics of the distributed trace context and its format. This ensures that every component in a distributed app may understand this context and propagate it to components it calls into.

Microsoft is working on making distributed apps development easier with many ongoing developments like Orleans framework and project Dapr. As for distributed trace context propagation – Microsoft services and platforms will be adopting a W3C Trace Context format.

We believe that ASP.NET Core must provide an outstanding experience for building distributed tracing apps. With every release of ASP.NET Core we execute on this promise. This post describes the scenario of distributed tracing and logging highlighting improvements in .NET Core 3.0 and talks about discussions of a new exciting features we plan to add going forward.

Distributed Tracing and Logging

Let’s explore distributed tracing in .NET Core 3.0 and improvements recently made. First, we’ll see how two “out of the box” ASP.NET Core 3.0 apps has logs correlated across the entire distributed trace. Second, we’ll explore how easy it is to set distributed trace context for any .NET Core application and how it will automatically be propagated across http. And third, we’ll see how the same distributed trace identity is used by telemetry SDKs like OpenTelemetry and ASP.NET Core logs.

This demo will also demonstrate how .NET Core 3.0 embraces W3C Trace Context standard and what other features it offers.

Demo set up

In this demo we will have three simple components: ClientApp, FrontEndApp and BackEndApp.

BackEndApp is a template ASP.NET Core application called WeatherApp. It exposes a REST API to get a weather forecast.

FrontEndApp proxies all incoming requests into the calls to BackEndApp using this controller:

[ApiController]
[Route("[controller]")]
public class WeatherForecastProxyController : ControllerBase
{ private readonly ILogger<WeatherForecastProxyController> _logger; private readonly HttpClient _httpClient; public WeatherForecastProxyController( ILogger<WeatherForecastProxyController> logger, HttpClient httpClient) { _logger = logger; _httpClient = httpClient; } [HttpGet] public async Task<IEnumerable<WeatherForecast>> Get() { var jsonStream = await _httpClient.GetStreamAsync("http://localhost:5001/weatherforecast"); var weatherForecast = await JsonSerializer.DeserializeAsync<IEnumerable<WeatherForecast>>(jsonStream); return weatherForecast; }
}

Finally, ClientApp is a .NET Core 3.0 Windows Forms app. ClientApp calls into FrontEndApp for the weather forecast.

private async Task<string> GetWeatherForecast()
{ return await _httpClient.GetStringAsync( "http://localhost:5000/weatherforecastproxy");
}

Please note, there were no additional SDKs enabled or libraries installed on demo apps. As the demo progresses – every code change will be mentioned.

Correlated logs

Let’s make the very first call from ClientApp and take a look at the logs produced by FrontEndApp and BackEndApp.

FrontEndApp (a few line breaks added for readability):

info: Microsoft.AspNetCore.Routing.EndpointMiddleware[1] => ConnectionId:0HLR1BR0PL1CH => RequestPath:/weatherforecastproxy RequestId:0HLR1BR0PL1CH:00000001, SpanId:|363a800a-4cf070ad93fe3bd8., TraceId:363a800a-4cf070ad93fe3bd8, ParentId:
Executed endpoint 'FrontEndApp.Controllers.WeatherForecastProxyController.Get (FrontEndApp)'

BackEndApp:

info: BackEndApp.Controllers.WeatherForecastController[0] => ConnectionId:0HLR1BMQHFKRL => RequestPath:/weatherforecast RequestId:0HLR1BMQHFKRL:00000002, SpanId:|363a800a-4cf070ad93fe3bd8.94c1cdba_, TraceId:363a800a-4cf070ad93fe3bd8, ParentId:|363a800a-4cf070ad93fe3bd8. Executed endpoint 'FrontEndApp.Controllers.WeatherForecastController.Get (BackEndApp)'

Like magic, logs from two independent apps share the same TraceId. Behind the scene, ASP.NET Core 3.0 app will initialize a distributed trace context and pass it in the header. This is how incoming headers to the BackEndApp looks like:

You may notice that FrontEndApp didn’t receive any additional headers:

The reason is that in ASP.NET Core apps – distributed trace being initiated by ASP.NET Core framework itself on every incoming request. Next section explains how to do it for any .NET Core 3.0 app.

Initiate distributed trace in .NET Core 3.0 app

You may have noticed the difference in behavior of Windows Forms ClientApp and ASP.NET Core FrontEndApp. ClientApp didn’t set any distributed trace context. So FrontEndApp didn’t receive it. It is easy to set up distributed operation. Easiest way to do it is to use an API called Activity from the DiagnosticSource package.

private async Task<string> GetWeatherForecast()
{ var activity = new Activity("CallToBackend").Start(); try { return await _httpClient.GetStringAsync( "http://localhost:5000/weatherforecastproxy"); } finally { activity.Stop(); }
}

Once you have started an activity, HttpClient knows that distributed trace context needs to be propagated. Now all three components – ClientApp, FrontEndApp and BackEndApp share the same TraceId.

W3C Trace Context support

You may notice that the context is propagating using the header called Request-Id. This header was introduced in Asp.Net Core 2.0 and is used by default for better compatibility with these apps. However, as the W3C Trace Context specification is being widely adopted, it is recommended to switch to this format of context propagation.

With .NET Core 3.0, it is easy to switch to W3C Trace Context format to propagate distributed trace identifiers. Easiest way to do it is in the main method- just add a simple line in the Main method:

static void Main()
{ Activity.DefaultIdFormat = ActivityIdFormat.W3C; … Application.Run(new MainForm());
}

Now, when the FrontEndApp receives requests from the ClientApp, you see a traceparent header in the request:

The ASP.NET Core app will understand this header and recognize that it needs to use W3C Trace Context format for outgoing calls now.

Note, ASP.NET Core apps will recognize the correct format of distributed trace context automatically. However, it is still a good practice to switch the default format of distributed trace context to W3C for better interoperability in heterogeneous environments.

You will see all the logs attributed with the TraceId and SpanId obtained from the incoming header:

info: Microsoft.AspNetCore.Hosting.Diagnostics[1] => ConnectionId:0HLQV2BC3VP2T => RequestPath:/weatherforecast RequestId:0HLQV2BC3VP2T:00000001, SpanId:da13aa3c6fd9c146, TraceId:f11a03e3f078414fa7c0a0ce568c8b5c, ParentId:5076c17d0a604244 Request starting HTTP/1.1 GET http://localhost:5000/weatherforecast

Activity and distributed tracing with OpenTelemetry

OpenTelemetry provides a single set of APIs, libraries, agents, and collector services to capture distributed traces and metrics from your application. You can analyze them using Prometheus, Jaeger, Zipkin, and other observability tools.

Let’s enable OpenTelemetry on the BackEndApp. It is very easy to do, just call AddOpenTelemetry on startup:

services.AddOpenTelemetry(b => b.UseZipkin(o => { o.ServiceName="BackEndApp"; o.Endpoint=new Uri("http://zipkin /api/v2/spans"); }) .AddRequestCollector());

Now, as we just saw, TraceId in the FrontEndApp logs will match TraceId in the BackEndApp.

info: Microsoft.AspNetCore.Mvc.Infrastructure.ControllerActionInvoker[2] => ConnectionId:0HLR2RC6BIIVO => RequestPath:/weatherforecastproxy RequestId:0HLR2RC6BIIVO:00000001, SpanId:54e2de7b9428e940, TraceId:e1a9b61ec50c954d852f645262c7b31a, ParentId:69dce1f155911a45 => FrontEndApp.Controllers.WeatherForecastProxyController.Get (FrontEndApp)
Executed action FrontEndApp.Controllers.WeatherForecastProxyController.Get (FrontEndApp) in 3187.3112ms info: Microsoft.AspNetCore.Mvc.Infrastructure.ControllerActionInvoker[2] => ConnectionId:0HLR2RLEHSKBV => RequestPath:/weatherforecast RequestId:0HLR2RLEHSKBV:00000001, SpanId:0e783a0867544240, TraceId:e1a9b61ec50c954d852f645262c7b31a, ParentId:54e2de7b9428e940 => BackEndApp.Controllers.WeatherForecastController.Get (BackEndApp)
Executed action BackEndApp.Controllers.WeatherForecastController.Get (BackEndApp) in 3085.9111ms

Furthermore, the same Trace will be reported by Zipkin. So now you can correlate distributed traces collected by your distributed tracing tool and logs from the machine. You can also give this TraceId to the user when ClientApp experience issues. The user can share it with your app support and corresponding logs and distributed traces can be easily discovered across all components.

Taking example one step further – you can easily enable monitoring for all three components and see them on the gantt chart.

ASP.NET Core apps integrates with distributed trace

As we just seen telemetry collected by Application Monitoring vendors is correlated using the same distributed trace context as ASP.NET Core uses. This makes ASP.NET Core 3.0 apps great for the environments where different components are owned by different teams.

Imagine that only two of apps – A and C on the picture below enabled telemetry collection using SDK like OpenTelemetry. Before ASP.NET Core 3.0 it would mean that distributed tracing will not work, and a trace will be “broken” by app B.

With ASP.NET Core 3.0, since in most deployments ASP.NET Core apps are configured with the basic logging enabled, app B will propagate distributed trace context. This distributed traces from A and C will be correlated.

With the example of apps from before – if ClientApp and BackEndApp are instrumented and FrontEndApp is not – you see distributed trace is still being correlated:

This also makes ASP.NET Core apps great for the service mesh environments. In service mesh deployments, A and C from the picture above may represent a service mesh. In order for service mesh to stitch request entering and leaving component B – certain headers have to be propagated by an app. See this note from the Istio for example:

Although Istio proxies are able to automatically send spans, they need some hints to tie together the entire trace. Applications need to propagate the appropriate HTTP headers so that when the proxies send span information, the spans can be correlated correctly into a single trace.

As we work with service mesh authors to adopt W3C Trace Context format, ASP.NET Core apps will “just work” and propagate needed headers.

Passing additional context

Talking about other scenarios, it is often the case that you want to share more context between components in a distributed app. Let’s say a ClientApp wants to send its version so all REST calls will know where the request is coming from. You can add these properties in Activity.Baggage like this:

private async Task<string> GetWeatherForecast()
{ var activity = new Activity("CallToBackend") .AddBaggage("appVersion", "v1.0") .Start(); try { return await _httpClient.GetStringAsync( "http://localhost:5000/weatherforecastproxy"); } finally { activity.Stop(); }
}

Now on server side you see an additional header Correlation-Context in both – FrontEndApp and BackEndApp.

And you can use the Activity.Baggage to attribute your logs:

var appVersion = Activity.Current.Baggage.FirstOrDefault(b => b.Key == "appVersion").Value;
using (_logger.BeginScope($"appVersion={appVersion}"))
{ _logger.LogInformation("this weather forecast is from random source");
}

And you see the scope now contains an appVersion:

info: FrontEndApp.Controllers.WeatherForecastController[0] => ConnectionId:0HLQV353507UG => RequestPath:/weatherforecast RequestId:0HLQV353507UG:00000001, SpanId:37a0f7ebf3ecac42, TraceId:c7e07b7719a7a3489617663753f985e4, ParentId:f5df77ba38504846 => FrontEndApp.Controllers.WeatherForecastController.Get (BackEndApp) => appVersion=v1.0 this weather forecast is from random source

Next steps

With the improvements for ASP.NET Core 3.0 we hear that some of the features included in ASP.NET Core is hard to consume. Developers and DevOps wants a turnkey telemetry solution that will work with many APM vendors. We believe that investments we are making in OpenTelemetry will allow more people to benefit from investments we are making in ASP.NET Core monitoring and troubleshooting. This is one of the big areas of investments for a team.

We also help people adopt W3C Trace Context everywhere and will be making it a default distributed trace context propagation format in future versions of ASP.NET Core.

Another area of investments is to improve distributed context propagation scenarios. Distributed apps comparing to monoliths are lacking common shared state with the lifetime of a single distributed trace. This shared state (or context) can be used for basic logging as was described in this article, as well as for advanced routing of requests, experimentation, A/B testing, business context propagation, etc. Some of scenarios are described in this epic: Distributed Context in ASP.NET and Open Telemetry.

Please send us your feedback and tell what improvements in distributed apps troubleshooting and monitoring we need to make.

Avatar

Posted on Leave a comment

New features in Red Hat CodeReady Studio 12.13.0.GA and JBoss Tools 4.13.0.Final for Eclipse 2019-09

JBoss Tools 4.13.0 and Red Hat CodeReady Studio 12.13 for Eclipse 2019-09 are here and waiting for you. In this article, I’ll cover the highlights of the new releases and show how to get started.

Installation

Red Hat CodeReady Studio (previously known as Red Hat Developer Studio) comes with everything pre-bundled in its installer. Simply download it from our Red Hat CodeReady Studio product page and run it like this:

java -jar codereadystudio-<installername>.jar

JBoss Tools or Bring-Your-Own-Eclipse (BYOE) CodeReady Studio requires a bit more.

This release requires at least Eclipse 4.13 (2019-09), but we recommend using the latest Eclipse 4.13 2019-09 JEE Bundle because then you get most of the dependencies pre-installed.

Once you have installed Eclipse, you can either find us on the Eclipse Marketplace under “JBoss Tools” or “Red Hat CodeReady Studio.”

For JBoss Tools, you can also use our update site directly:

http://download.jboss.org/jbosstools/photon/stable/updates/

What’s new?

Our main focus for this release was improvements for container-based development and bug fixing. Eclipse 2019-06 itself has a lot of new cool stuff, but I’ll highlight just a few updates in both Eclipse 2019-06 and JBoss Tools plugins that I think are worth mentioning.

Red Hat OpenShift

OpenShift Container Platform 4.2 support

With the new OpenShift Container Platform (OCP) 4.2 now available (see the announcement), even if this is a major shift compared to OCP 3, Red Hat CodeReady Studio and JBoss Tools are compatible with this major release in a transparent way. Just define your connection to your OCP 4.2 based cluster as you did before for an OCP 3 cluster, and use the tooling!

CodeReady Containers 1.0 Server Adapter

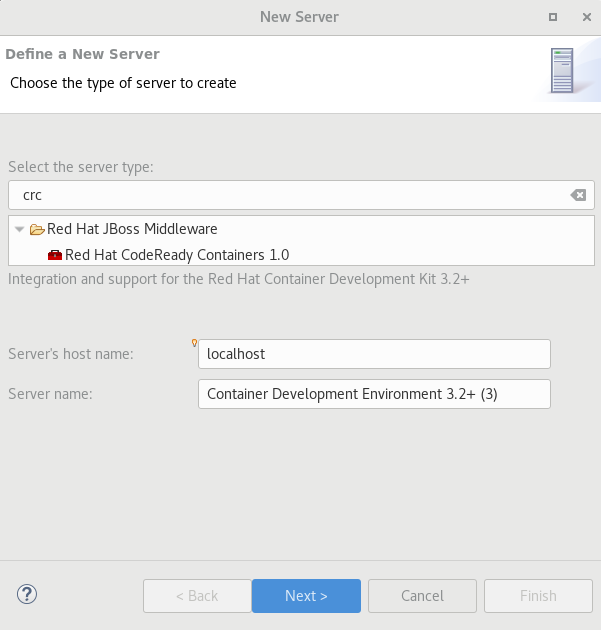
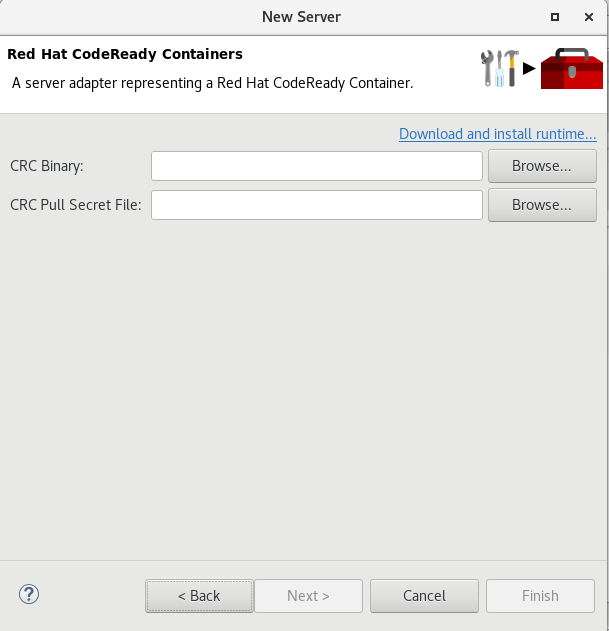
A new server adapter has been added to support the next generation of CodeReady Containers 1.0. Although the server adapter itself has limited functionality, it is able to start and stop the CodeReady Containers virtual machine via its crc binary. Simply hit Ctrl+3 (Cmd+3 on OSX) and type new server, which will bring up a command to set up a new server.

crc server adapter

Enter crc in the filter textbox.

You should see the Red Hat CodeReady Containers 1.0 server adapter.

Select Red Hat CodeReady Containers 1.0 and click Next.

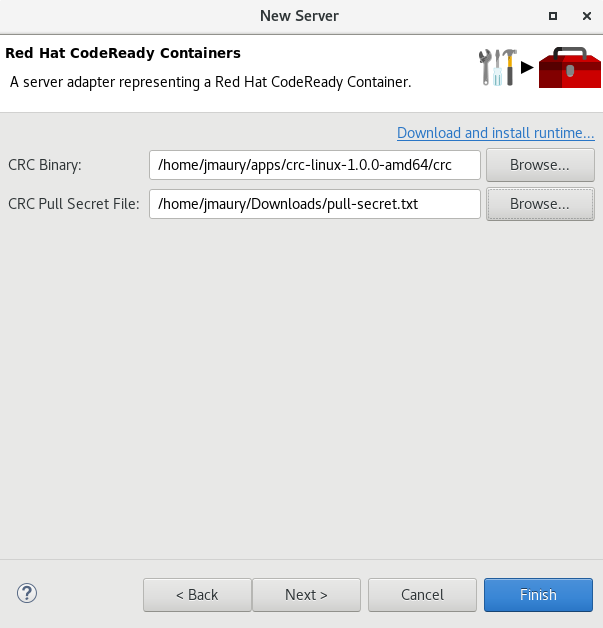
All you have to do is set the location of the CodeReady Containers crc binary file and the pull secret file location, which can be downloaded from https://cloud.redhat.com/openshift/install/crc/installer-provisioned.

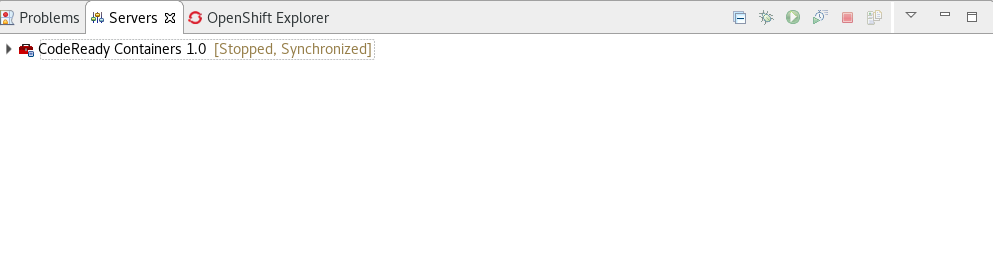
Once you’re finished, a new CodeReady Containers server adapter will then be created and visible in the Servers view.

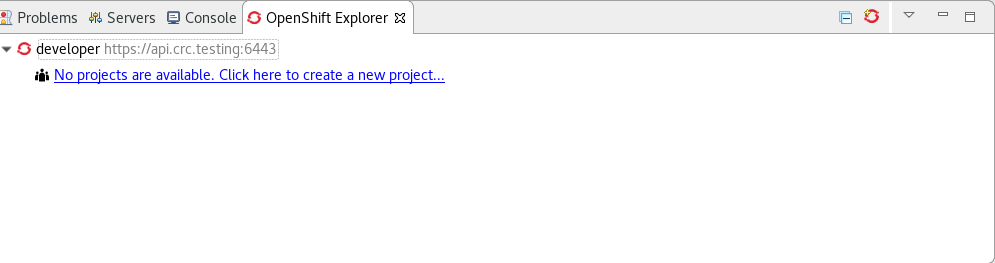
Once the server is started, a new OpenShift connection should appear in the OpenShift Explorer view, allowing the user to quickly create a new Openshift application and begin developing their AwesomeApp in a highly replicatable environment.

Server tools

Wildfly 18 Server Adapter

A server adapter has been added to work with Wildfly 18. It adds support for Java EE 8 and Jakarta EE 8.

EAP 7.3 Beta Server Adapter

A server adapter has been added to work with EAP 7.3 Beta.

Hibernate Tools

Hibernate Runtime Provider Updates

A number of additions and updates have been performed on the available Hibernate runtime providers.

The Hibernate 5.4 runtime provider now incorporates Hibernate Core version 5.4.7.Final and Hibernate Tools version 5.4.7.Final.

The Hibernate 5.3 runtime provider now incorporates Hibernate Core version 5.3.13.Final and Hibernate Tools version 5.3.13.Final.

Platform

Views, Dialogs and Toolbar

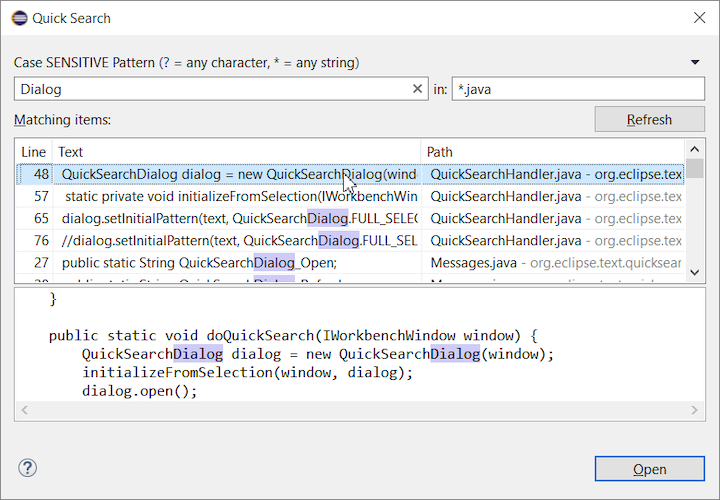
The new Quick Search dialog provides a convenient, simple and fast way to run a textual search across your workspace and jump to matches in your code. The dialog provides a quick overview showing matching lines of text at a glance. It updates as quickly as you can type and allows for quick navigation using only the keyboard. A typical workflow starts by pressing the keyboard shortcut Ctrl+Alt+Shift+L (or Cmd+Alt+Shift+L on Mac). Typing a few letters updates the search result as you type. Use Up-Down arrow keys to select a match, then hit Enter to open it in an editor.

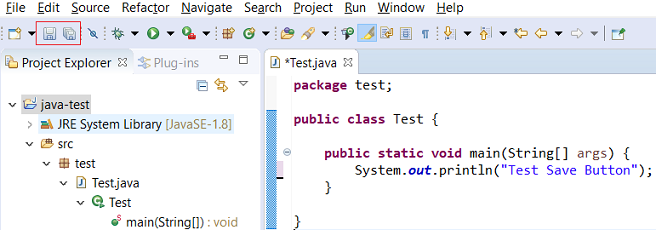
Save editor when Project Explorer has focus

You can now save the active editor even when the Project Explorer has focus. In cases where an extension contributes Saveables to the Project Explorer, the extension is honored and the save action on the Project Explorer will save the provided saveable item instead of the active editor.

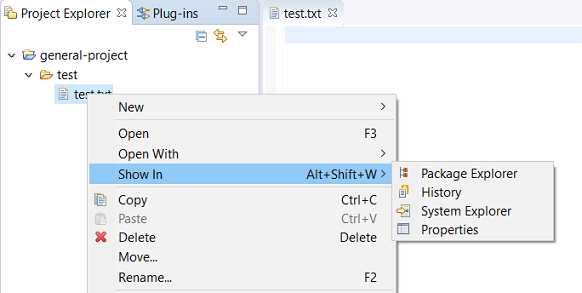
“Show In” context menu available for normal resources

The Show In context menu is now available for an element inside a resource project on the Project Explorer.

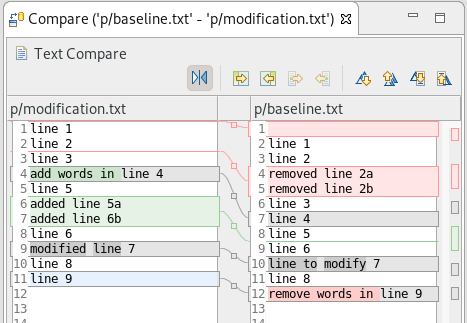
Show colors for additions and deletions in Compare viewer

In simple cases such as a two-way comparison or a three-way comparison with no merges and conflicts, the Compare viewer now shows different colors, depending on whether text has been added, removed, or modified. The default colors are green, red, and black, respectively.

The colors can be customized through usual theme customization approaches, including using related entries in the Colors and Fonts preference page.

Editor status line shows more selection details

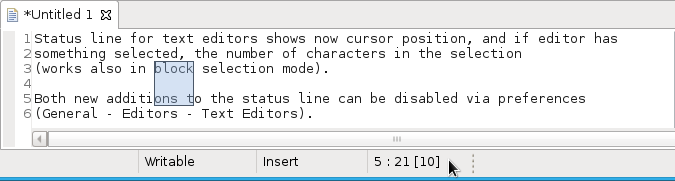
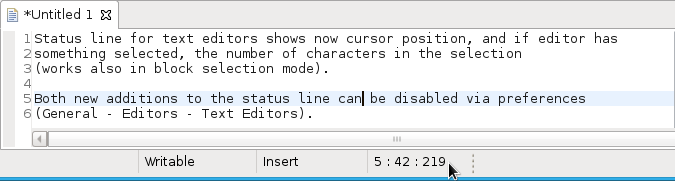
The status line for Text Editors now shows the cursor position, and when the editor has something selected, it shows the number of characters in the selection as well. This also works in the block selection mode.

These two new additions to the status line can be disabled via the General > Editors > Text Editors preference page.

Shorter dialog text

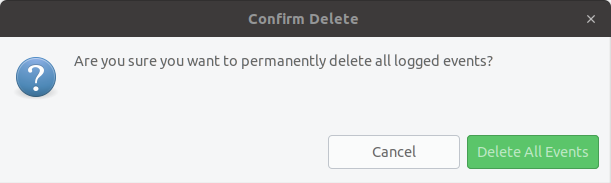
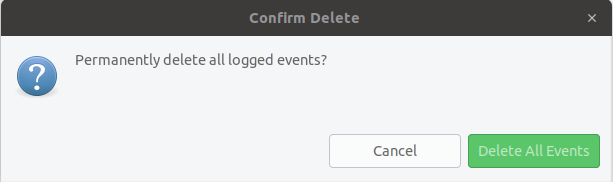
Several dialog texts have been shortened. This allows you to capture important information faster.

Previously:

Now:

Close project via middle-click

In the Project Explorer, you can now close a project using middle-click.

Debug

Improved usability of Environment tab in Launch Configurations

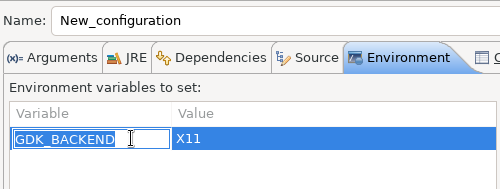
In the Environment tab of the Launch Configuration dialog, you can now double-click on an environment variable name or value and start editing it directly from the table.

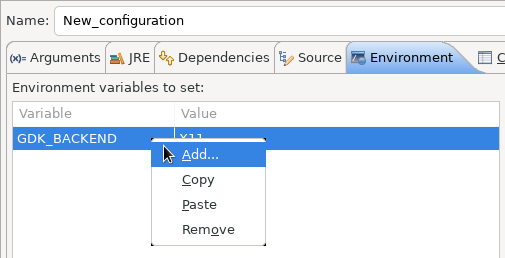
Right-clicking on the environment variable table now opens a context menu, allowing for quick addition, removal, copying, and pasting of environment variables.

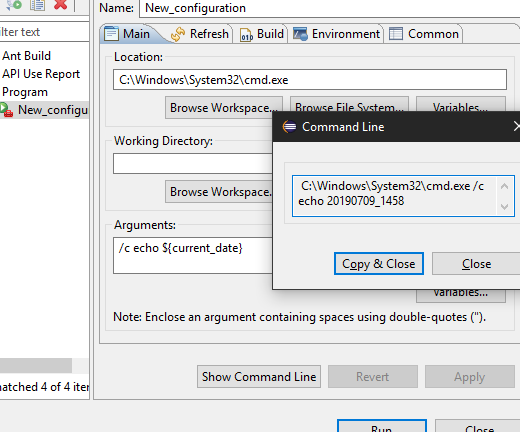
Show Command Line for external program launch

The External Tools Configuration dialog for launching an external program now supports the Show Command Line button.

Preferences

Close editors automatically when reaching 99 open editors

The preference to close editors automatically is now enabled by default. It will be triggered when you have opened 99 files. If you continue to open editors, old editors will be closed to protect you from performance problems. You can modify this setting in the Preferences dialog via the General > Editors > Close editors automatically preference.

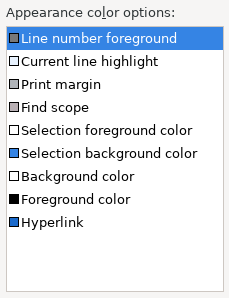
In-table color previews for Text Editor appearance color options

You can now see all the colors currently being used in Text Editors from the Appearance color options table, located in the Preferences > General > Editors > Text Editor page.

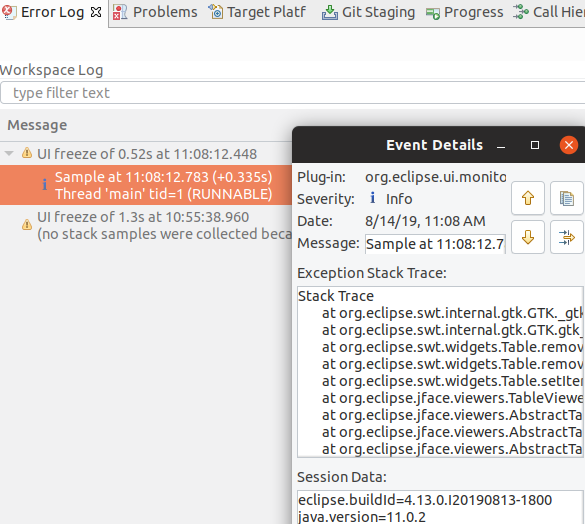
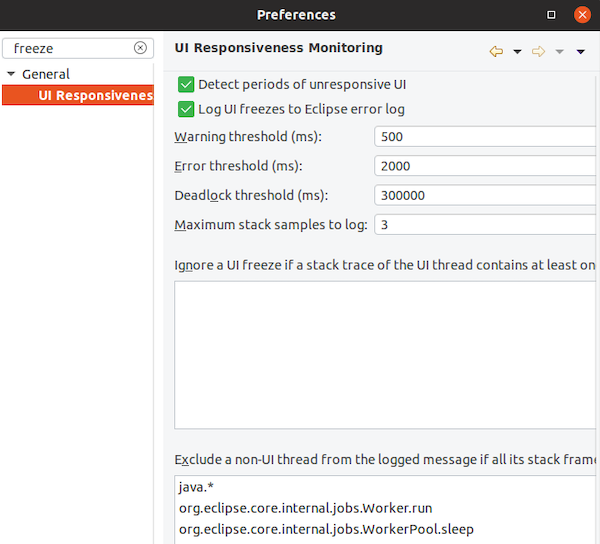
Automatic detection of UI freezes in the Eclipse SDK

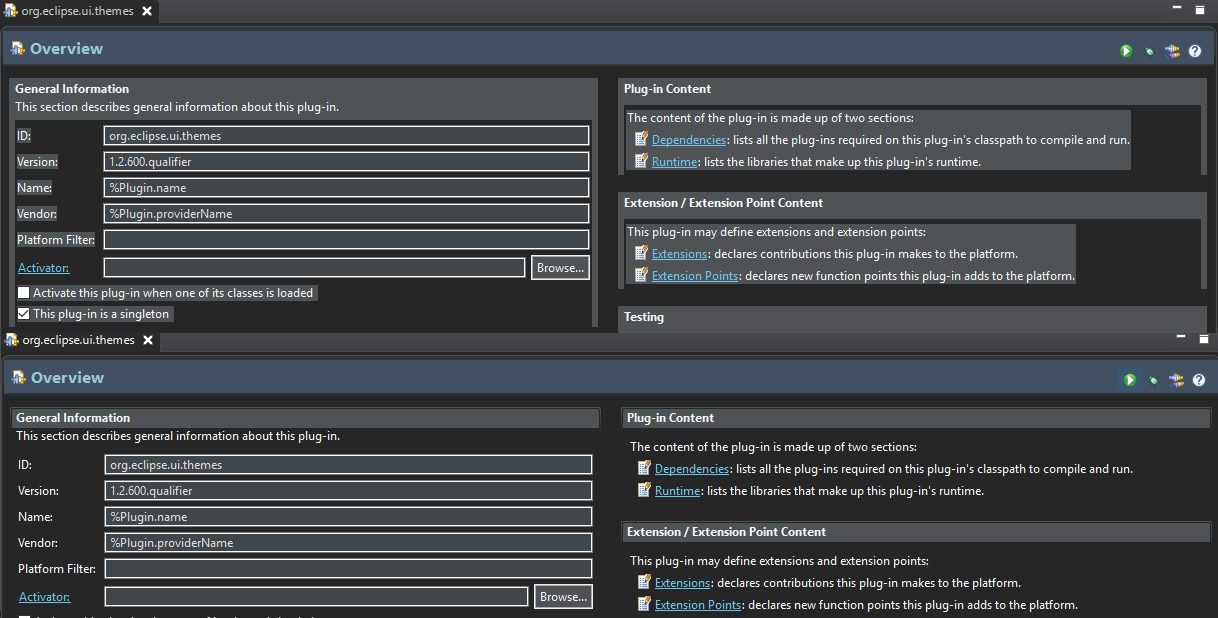
The Eclipse SDK has been configured to show stack traces for UI freezes in the Error Log view by default for new workspaces. You can use this information to identify and report slow parts of the Eclipse IDE.

You can disable the monitoring or tweak its settings via the options in the General > UI Responsiveness Monitoring preference page as shown below.

Themes and Styling

Start automatically in dark theme based on OS theme

On Linux and Mac, Eclipse can now start automatically in dark theme when the OS theme is dark. This works by default, that is on a new workspace or when the user has not explicitly set or changed the theme in Eclipse.

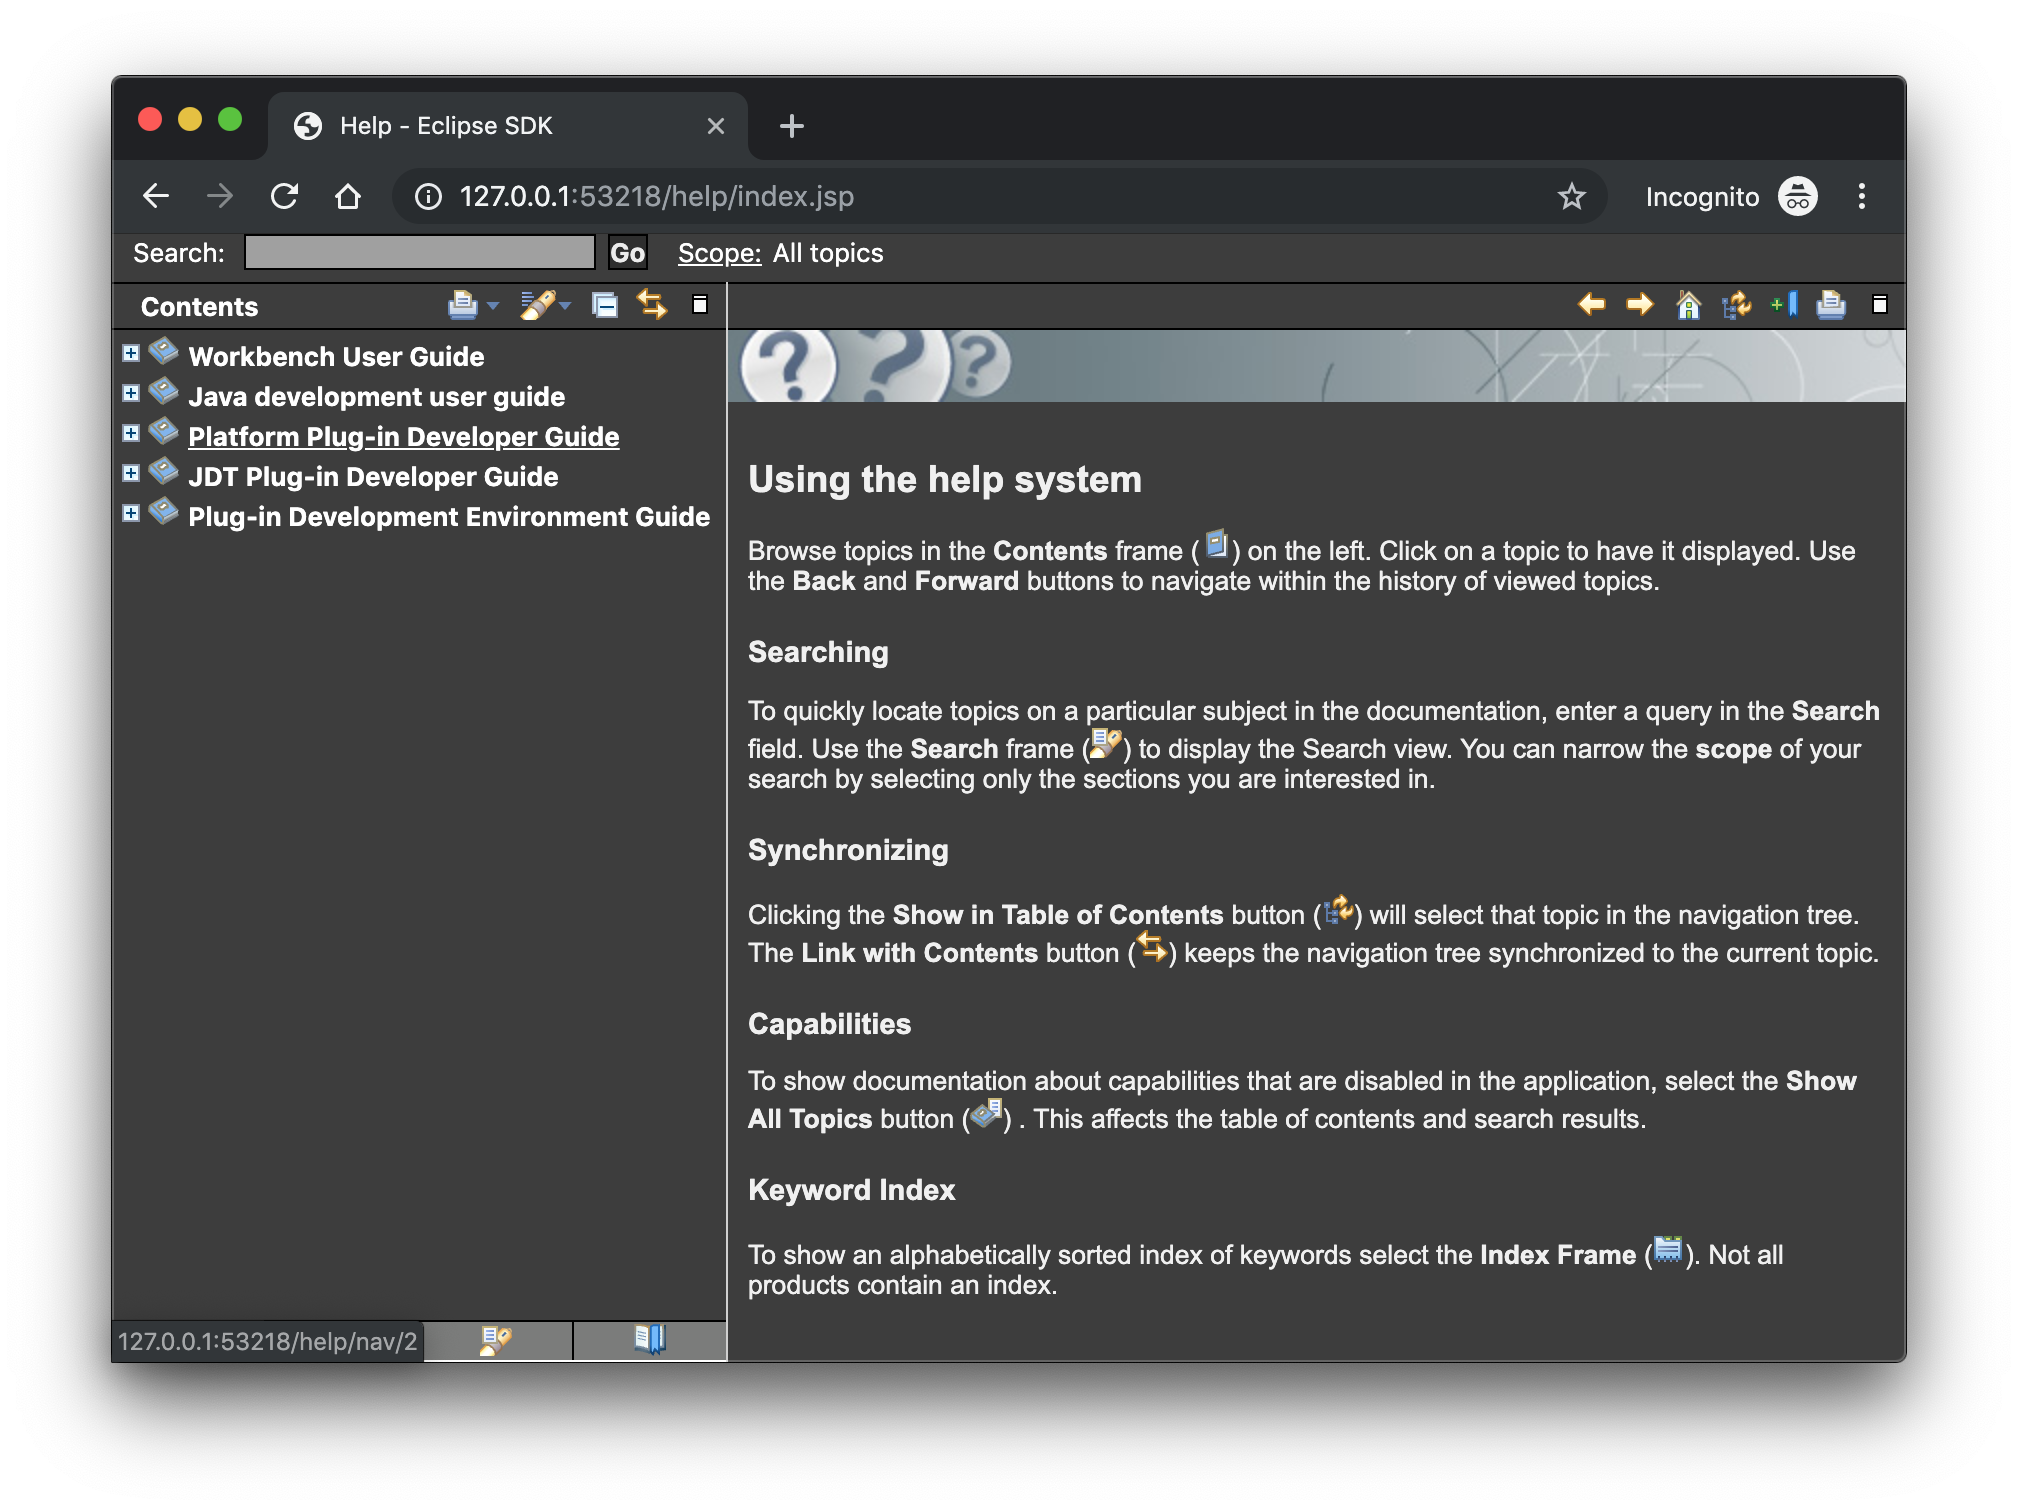
Display of Help content respects OS theme

More and more operating systems provide a system-wide dark theme. Eclipse now respects this system-wide theme setting when the Eclipse help content is displayed in an external browser. A prerequisite for this is a browser that supports the prefers-color-scheme CSS media query.

As of the time of writing, the following browser versions support it:

  • Firefox version 67
  • Chrome version 76
  • Safari version 12.1

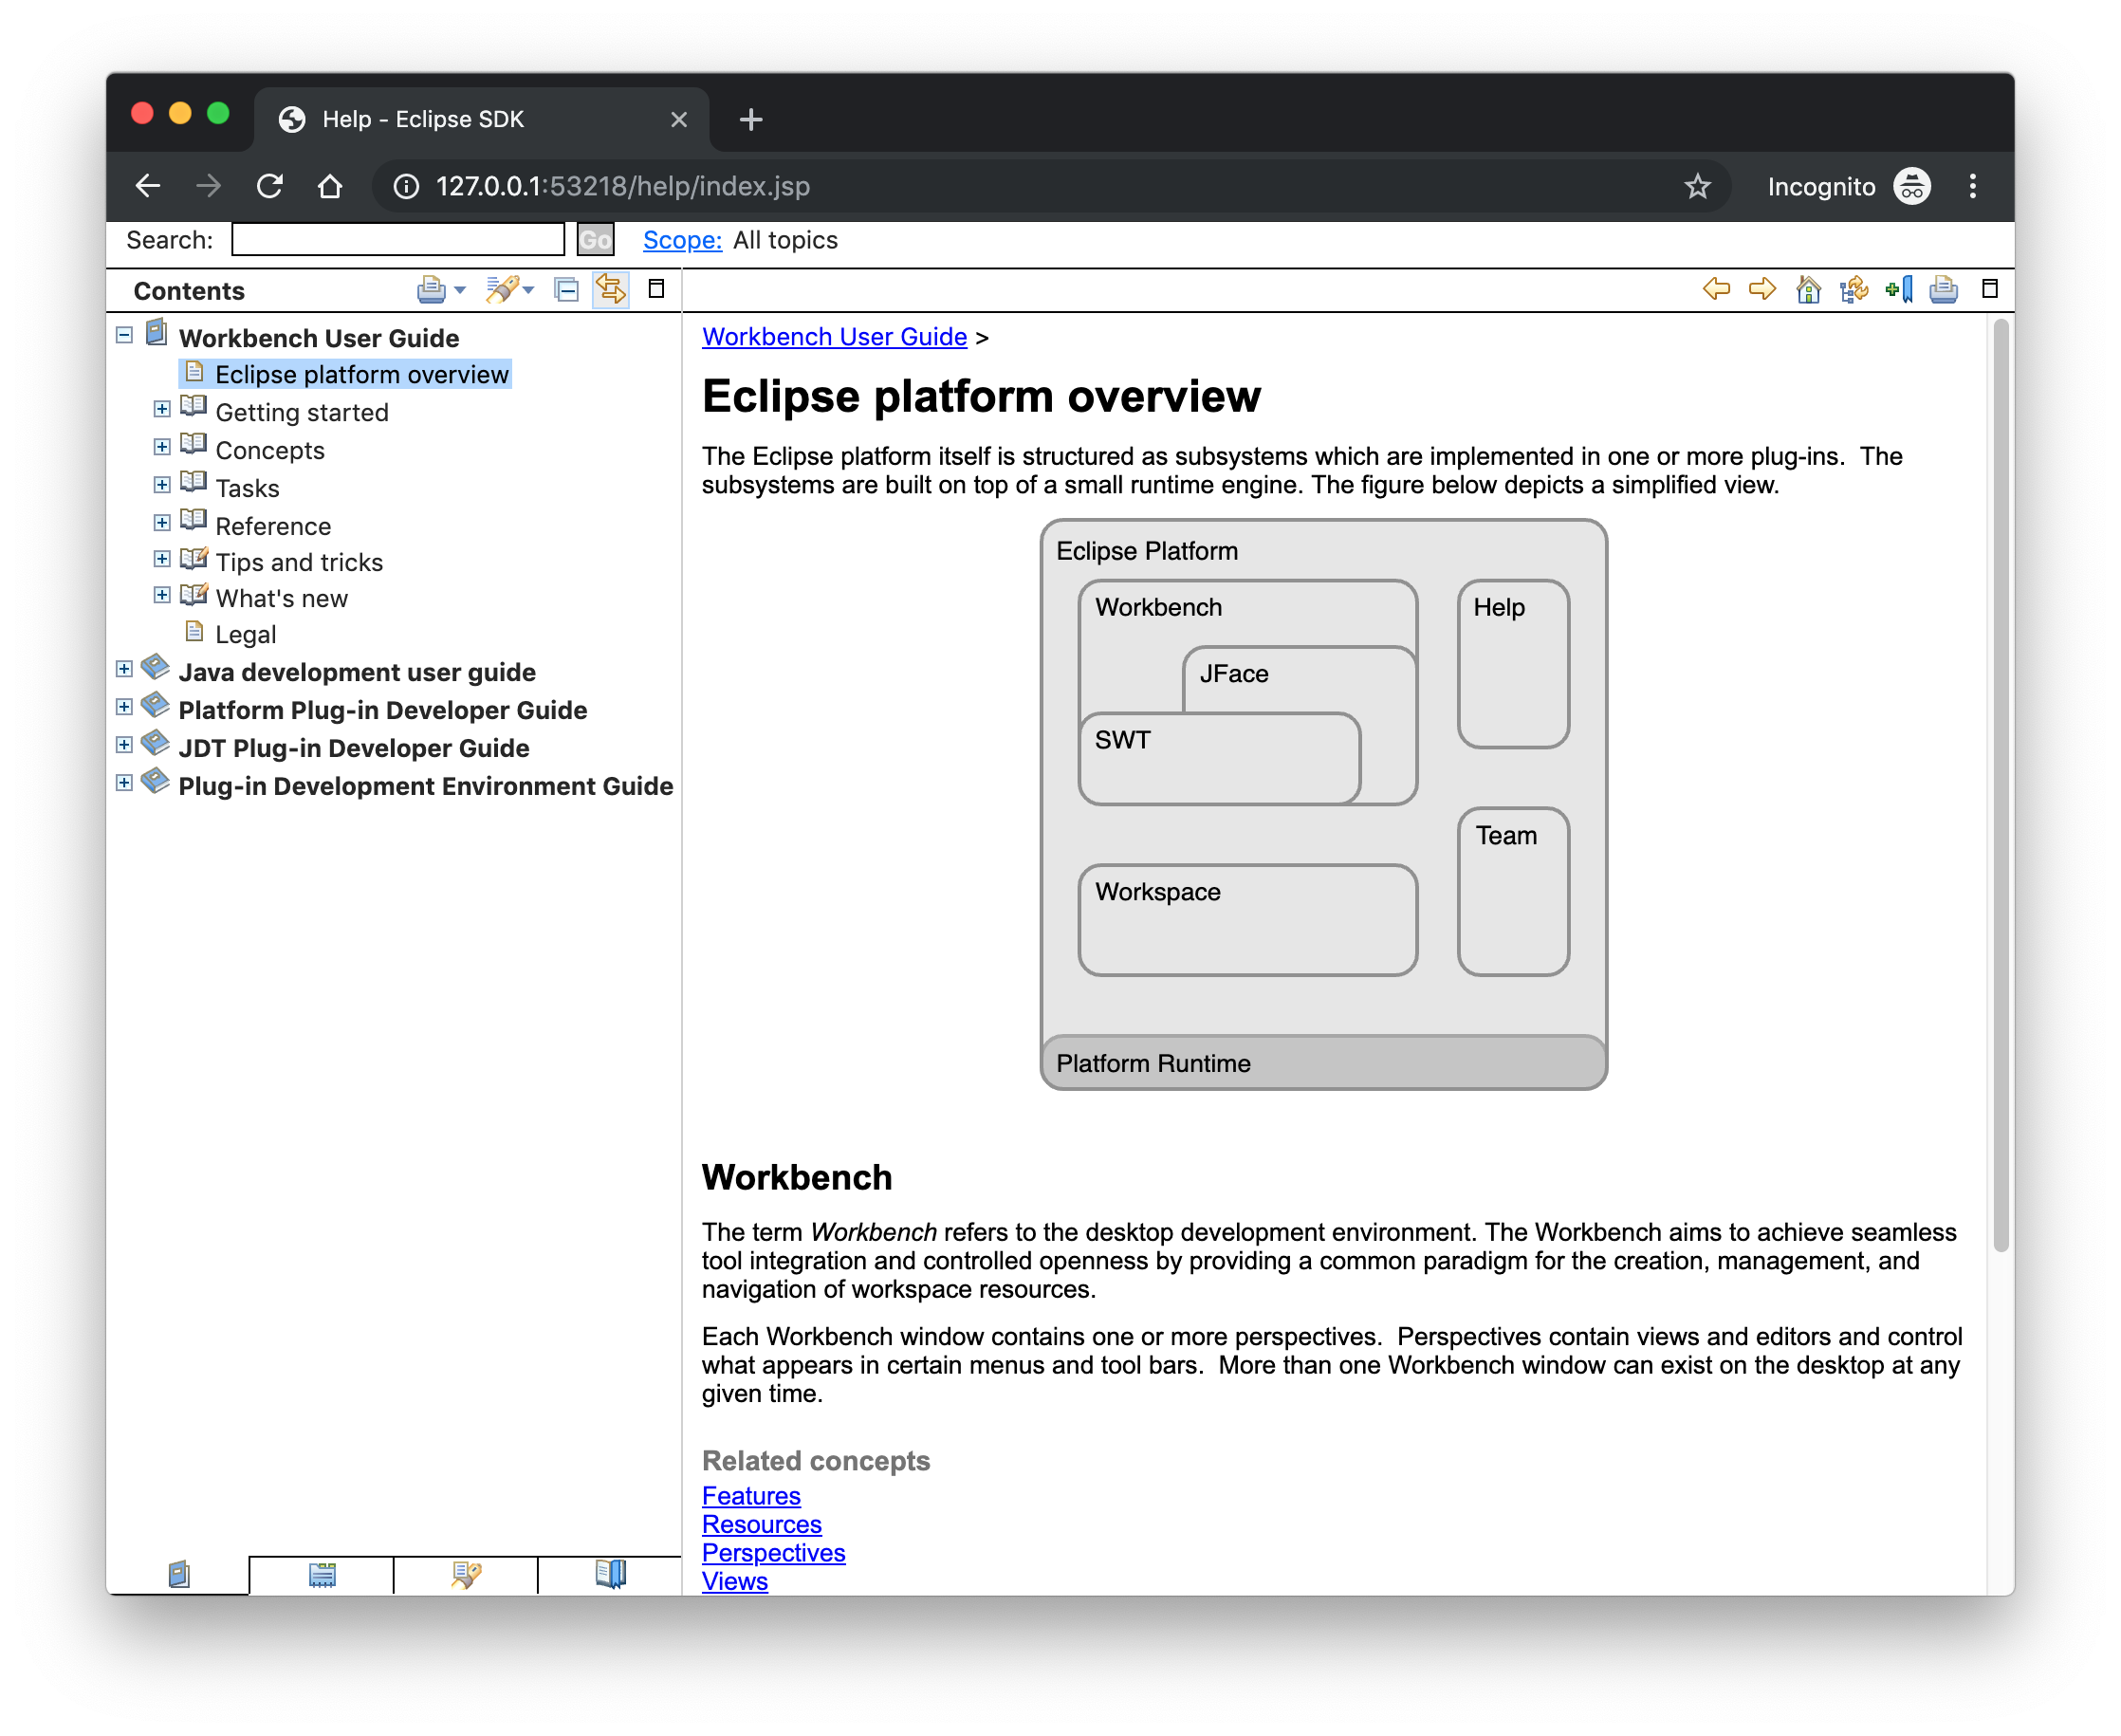
Help content uses high-resolution icons.

The Help System, as well as the help content of the Eclipse Platform, the Java Development Tooling, and the Plug-in Development Environment, now uses high-resolution icons. They are now crisp on high-resolution displays and also look much better in the dark theme.

Improved dark theme on Windows

Labels, Sections, Checkboxes, Radio Buttons, FormTexts, and Sashes on forms now use the correct background color in the dark mode on windows.

General Updates

Interactive performance

Interactive performance has been further improved in this release and several UI freezes have been fixed.

Show key bindings when command is invoked

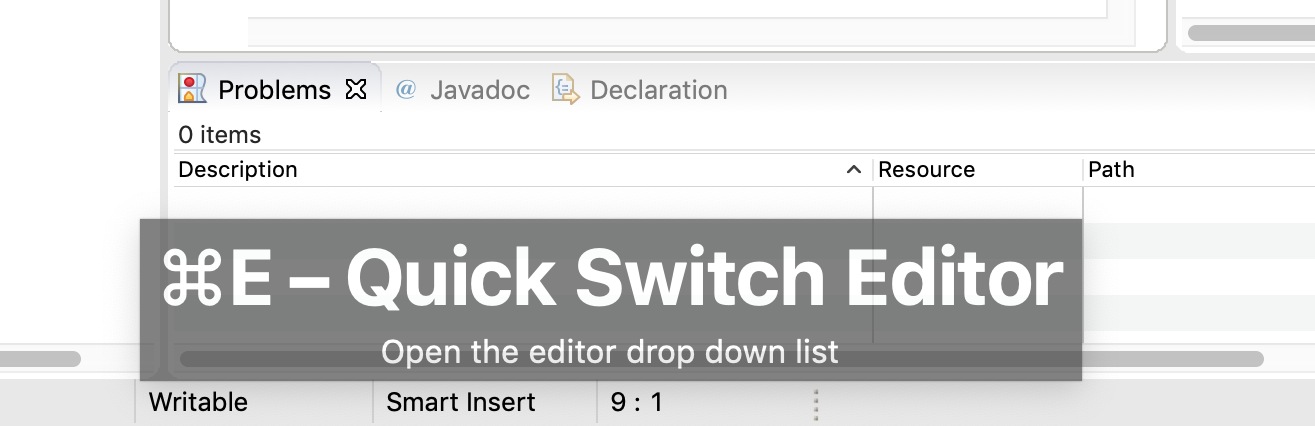
For presentations, screencasts, and learning purposes, it is very helpful to show the corresponding key binding when a command is invoked. When the command is invoked (via a key binding or menu interaction) the key binding, the command’s name and description are shown on the screen.

You can activate this in the Preferences dialog via the Show key binding when command is invoked checkbox on the General > Keys preference page. To toggle this setting quickly, you can use the Toggle Whether to Show Key Binding command (e.g., via the quick access).

Java Developement Tools (JDT)

Java 13 Support

Java 13 is out, and Eclipse JDT supports Java 13 for 4.13 via Marketplace.

The release notably includes the following Java 13 features:

  • JEP 354: Switch Expressions (Preview).
  • JEP 355: Text Blocks (Preview).

Please note that these are preview language features; hence, the enable preview option should be on. For an informal introduction of the support, please refer to Java 13 Examples wiki.

Java Views and Dialogs

Synchronize standard and error output in console

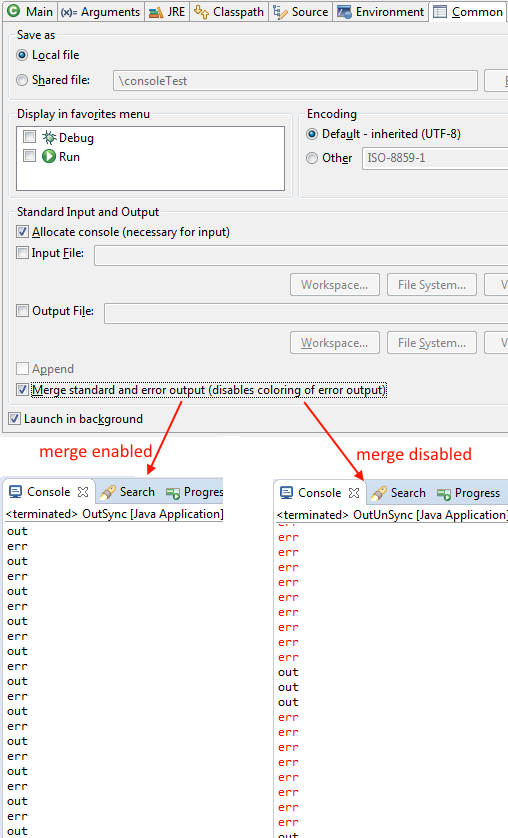
The Eclipse Console view currently can not ensure that mixed standard and error output is shown in the same order as it is produced by the running process. For Java applications, the launch configuration Common tab now provides an option to merge standard and error output. This ensures that standard and error output is shown in the same order it was produced but also disables the individual coloring of error output.

Java Editor

Convert to enhanced ‘for’ loop using Collections

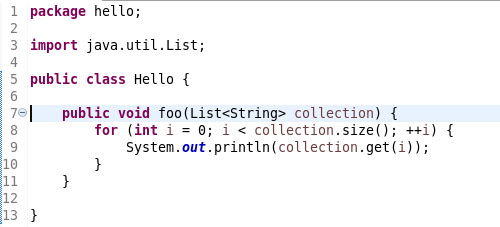
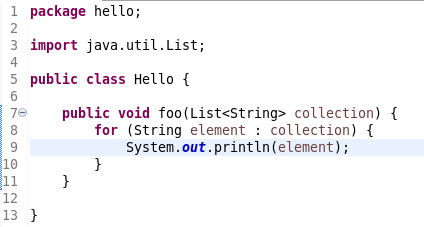
The Java quickfix/cleanup Convert to enhanced ‘for’ loop is now offered on for loops that are iterating through Collections. The loop must reference the size method as part of the condition and if accessing elements in the body, must use the get method. All other Collection methods other than isEmpty invalidate the quickfix being offered.

Initialize ‘final’ fields

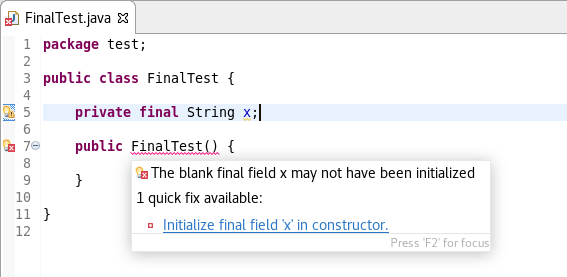
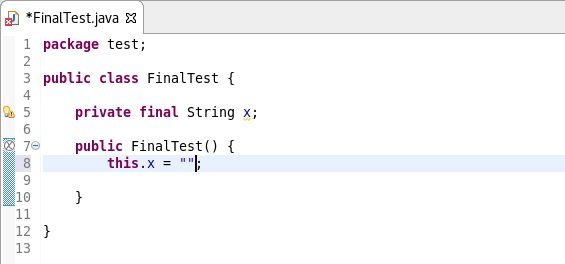
A Java quickfix is now offered to initialize an uninitialized final field in the class constructor. The fix will initialize a String to the empty string, a numeric base type to 0, and, for class fields, it initializes them using their default constructor if available or null if no default constructor exists.

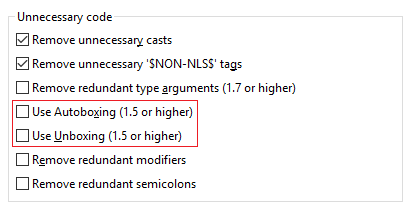
Autoboxing and Unboxing

Use Autoboxing and Unboxing when possible. These features are enabled only for Java 5 and higher.

Improved redundant modifier removal

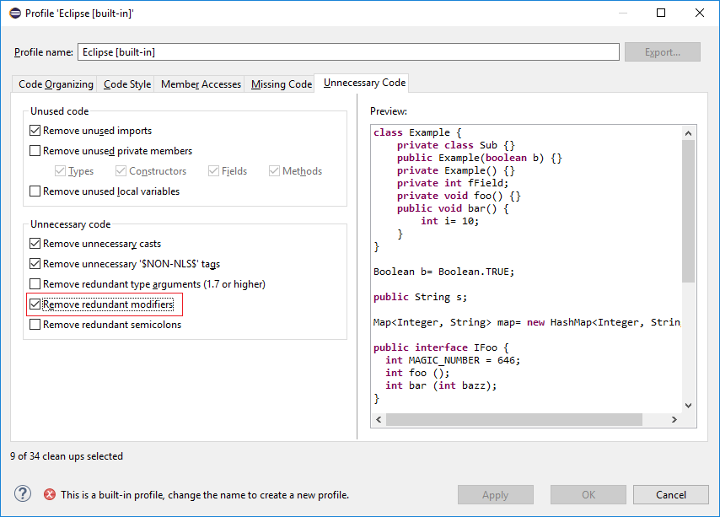
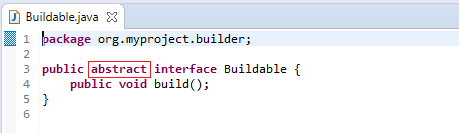
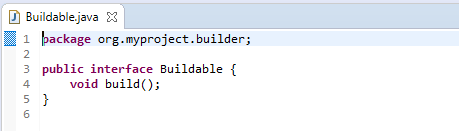
The Remove redundant modifier now also removes useless abstract modifier on the interfaces.

For the given code:

You get this:

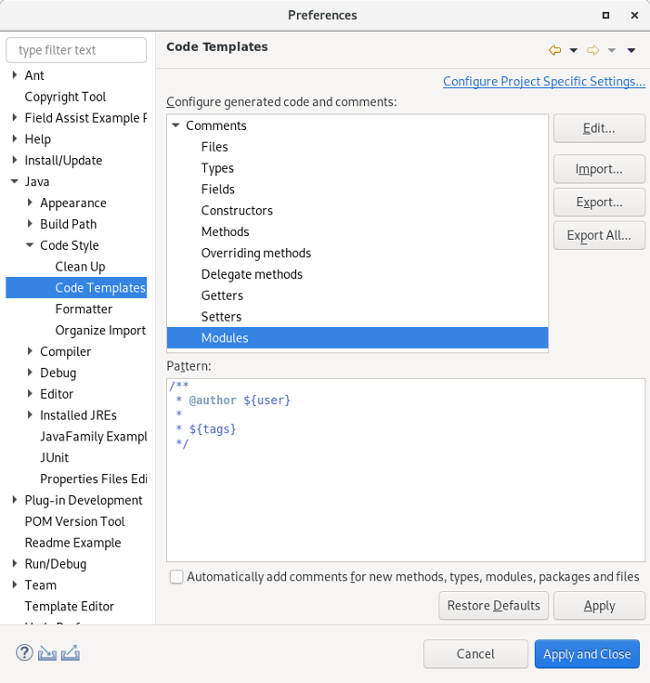
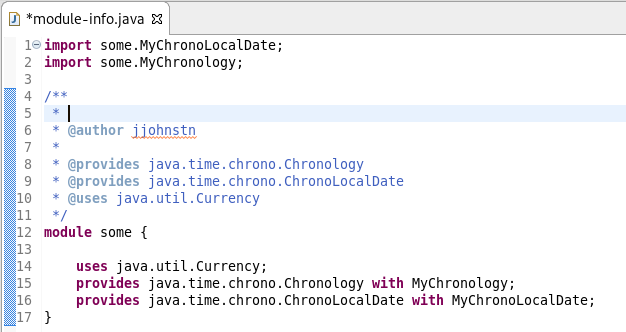
Javadoc comment generation for module

Adding a Javadoc comment to a Java module (module-info.java) will result in automatic annotations being added per the new module comment preferences.

The $(tags) directive will add @uses and @provides tags for all uses and provides module statements.

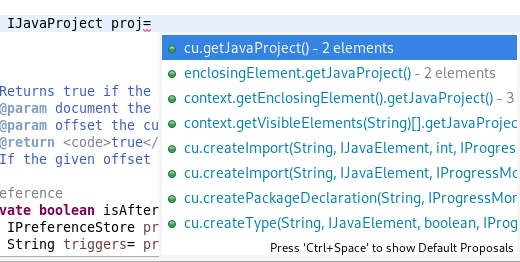
Chain Completion Code Assist

Code assist for “Chain Template Proposals” will be available. These will traverse reachable local variables, fields, and methods, to produce a chain whose return type is compatible with the expected type in a particular context.

The preference to enable the feature can be found in the Advanced sub-menu of the Content Assist menu group (Preferences > Java > Editor > Content Assist > Advanced).

Java Formatter

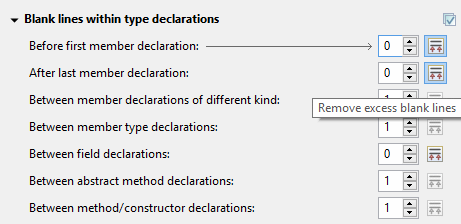
Remove excess blank lines

All the settings in the Blank lines section can now be configured to remove excess blank lines, effectively taking precedence over the Number of empty lines to preserve setting. Each setting has its own button to turn the feature on, right next to its number control. The button is enabled only if the selected number of lines is smaller than the Number of empty lines to preserve; otherwise, any excess lines are removed anyway.

Changes in blank lines settings

There’s quite a lot of changes in the Blank lines section of the formatter profile.

Some of the existing subsections and settings are now phrased differently to better express their function:

  • The Blank lines within class declarations subsection is now Blank lines within type declaration.
  • Before first declaration is now Before first member declaration.
  • Before declarations of the same kind is now Between member declarations of different kind.
  • Before member class declarations is now Between member type declarations.
  • Before field declarations is now Between field declarations.
  • Before method declarations is now Between method/constructor declarations.

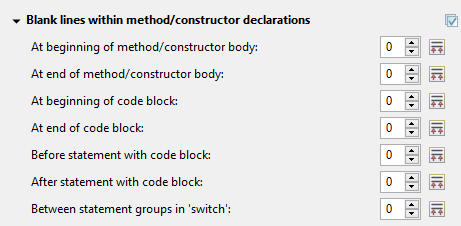
More importantly, a few new settings have been added to support more places where the number of empty lines can be controlled:

  • After last member declaration in a type (to complement previously existing Before first member declaration setting).
  • Between abstract method declarations in a type (these cases were previously handled by Between method/constructor declarations).
  • At end of method/constructor body (to complement previously existing At beginning of method/constructor body setting).
  • At beginning of code block and At end of code block.
  • Before statement with code block and After statement with code block.
  • Between statement groups in ‘switch.’

Most of the new settings have been put in a new subsection Blank lines within method/constructor declarations.

JUnit

JUnit 5.5.1

JUnit 5.5.1 is here and Eclipse JDT has been updated to use this version.

Debug

Enhanced support for –patch-module during launch

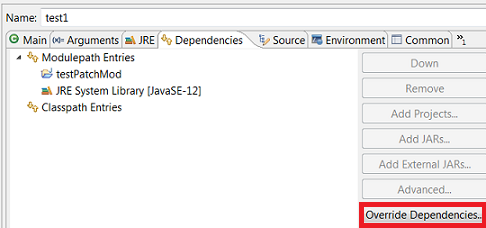
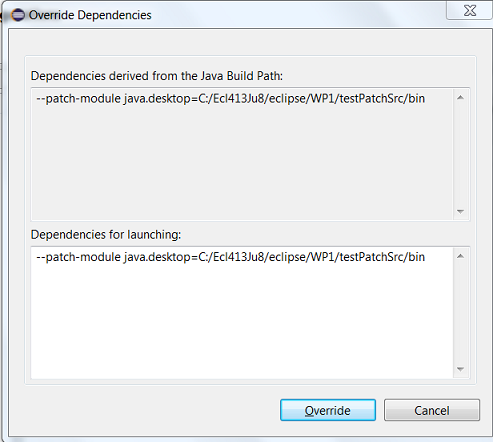
The Java Launch Configuration now supports patching of different modules by different sources during the launch. This can be verified in the Override Dependencies…​ dialog in the Dependencies tab in a Java Launch Configuration.

Java Build

Full build on JDT core preferences change

Manually changing the settings file .settings/org.eclipse.jdt.core.prefs of a project will result in a full project build, if the workspace auto-build is on. For example, pulling different settings from a git repository or generating the settings with a tool will now trigger a build. Note that this includes timestamp changes, even if actual settings file contents were not changed.

For the 4.13 release, it is possible to disable this new behavior with the VM property: -Dorg.eclipse.disableAutoBuildOnSettingsChange=true. It is planned to remove this VM property in a future release.

And more…​

You can find more noteworthy updates in on this page.

What is next?

Having JBoss Tools 4.13.0 and Red Hat CodeReady Studio 12.13 out we are already working on the next release for Eclipse 2019-12.

Share

The post New features in Red Hat CodeReady Studio 12.13.0.GA and JBoss Tools 4.13.0.Final for Eclipse 2019-09 appeared first on Red Hat Developer.

Posted on Leave a comment

Top Programming Languages Of 2019

Every year GitHub release their State of the Octoverse report containing a huge number of insights drawn from datamining the massive number of public and private repositories on GitHub.  One of the most interesting parts of the report is always the most popular programming languages.  This year, the 10 most popular programming languages on GitHub are:

  1. JavaScript
  2. Python
  3. Java
  4. PHP
  5. C#
  6. C++
  7. TypeScript
  8. Shell
  9. C
  10. Ruby

The list was created using the following criteria:

Top 10 primary languages over time, ranked by number of unique contributors to public and private repositories tagged with the appropriate primary language.

Every year Stack Overflow have a similar report, drawn instead from a developer survey.  The language popularity reports are remarkably consistent between the two 2019 reports.

You can learn more about the reports watching the video below.

[youtube https://www.youtube.com/watch?v=mkdAoAY41T0&w=853&h=480]

GameDev News Programming


Posted on Leave a comment

Quarkus: Modernize “helloworld” JBoss EAP quickstart, Part 1

Quarkus is, in its own words, “Supersonic subatomic Java” and a “Kubernetes native Java stack tailored for GraalVM & OpenJDK HotSpot, crafted from the best of breed Java libraries and standards.” For the purpose of illustrating how to modernize an existing Java application to Quarkus, I will use the Red Hat JBoss Enterprise Application Platform (JBoss EAP) quickstarts helloworld quickstart as sample of a Java application builds using technologies (CDI and Servlet 3) supported in Quarkus.

It’s important to note that both Quarkus and JBoss EAP rely on providing developers with tools based—as much as possible—on standards. If your application is not already running on JBoss EAP, there’s no problem. You can migrate it from your current application server to JBoss EAP using the Red Hat Application Migration Toolkit. After that, the final and working modernized version of the code is available in the https://github.com/mrizzi/jboss-eap-quickstarts/tree/quarkus repository inside the helloworld module.

This article is based on the guides Quarkus provides, mainly Creating Your First Application and Building a Native Executable.

Get the code

To start, clone the JBoss EAP quickstarts repository locally, running:

$ git clone https://github.com/jboss-developer/jboss-eap-quickstarts.git Cloning into 'jboss-eap-quickstarts'... remote: Enumerating objects: 148133, done. remote: Total 148133 (delta 0), reused 0 (delta 0), pack-reused 148133 Receiving objects: 100% (148133/148133), 59.90 MiB | 7.62 MiB/s, done. Resolving deltas: 100% (66476/66476), done. $ cd jboss-eap-quickstarts/helloworld/

Try plain, vanilla helloworld

The name of the quickstart is a strong clue about what this application does, but let’s follow a scientific approach in modernizing this code, so first things first: Try the application as it is.

Deploy helloworld

  1. Open a terminal and navigate to the root of the JBoss EAP directory EAP_HOME (which you can download).
  2. Start the JBoss EAP server with the default profile by typing the following command:
$ EAP_HOME/bin/standalone.sh 

Note: For Windows, use the EAP_HOME\bin\standalone.bat script.

After a few seconds, the log should look like:

[org.jboss.as] (Controller Boot Thread) WFLYSRV0025: JBoss EAP 7.2.0.GA (WildFly Core 6.0.11.Final-redhat-00001) started in 3315ms - Started 306 of 527 services (321 services are lazy, passive or on-demand)
  1. Open http://127.0.0.1:8080 in a browser, and a page like Figure 1 should appear:
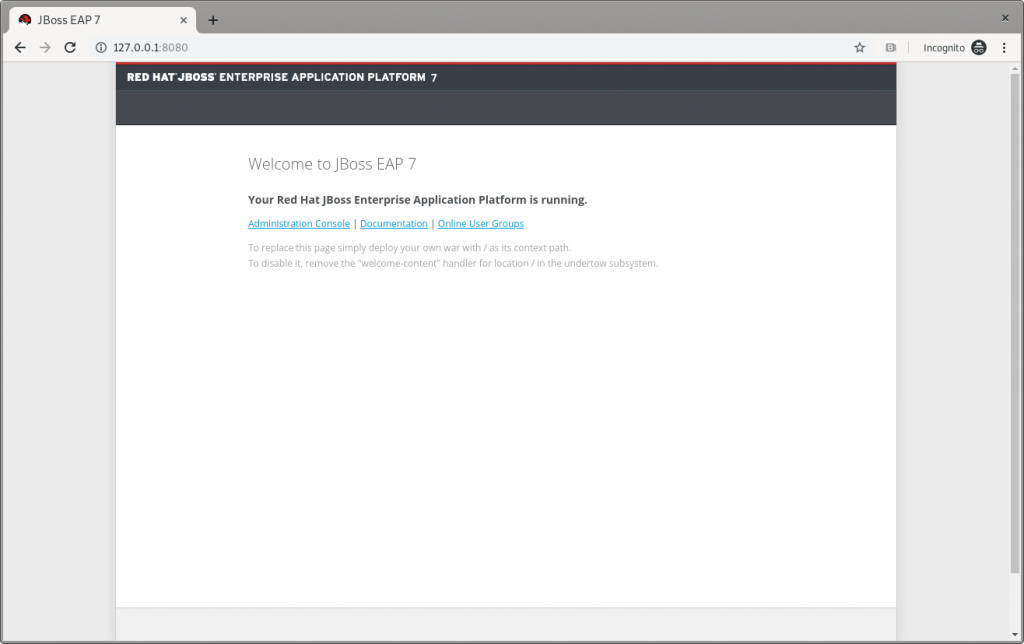
The JBoss EAP home page.

Figure 1: The JBoss EAP home page.

  1. Following instructions from Build and Deploy the Quickstart, deploy the helloworld quickstart and execute (from the project root directory) the command:
$ mvn clean install wildfly:deploy 

This command should end successfully with a log like this:

[INFO] ------------------------------------------------------------------------ [INFO] BUILD SUCCESS [INFO] ------------------------------------------------------------------------ [INFO] Total time: 8.224 s 

The helloworld application has now been deployed for the first time in JBoss EAP in about eight seconds.

Test helloworld

Following the Access the Application guide, open http://127.0.0.1:8080/helloworld in the browser and see the application page, as shown in Figure 2:
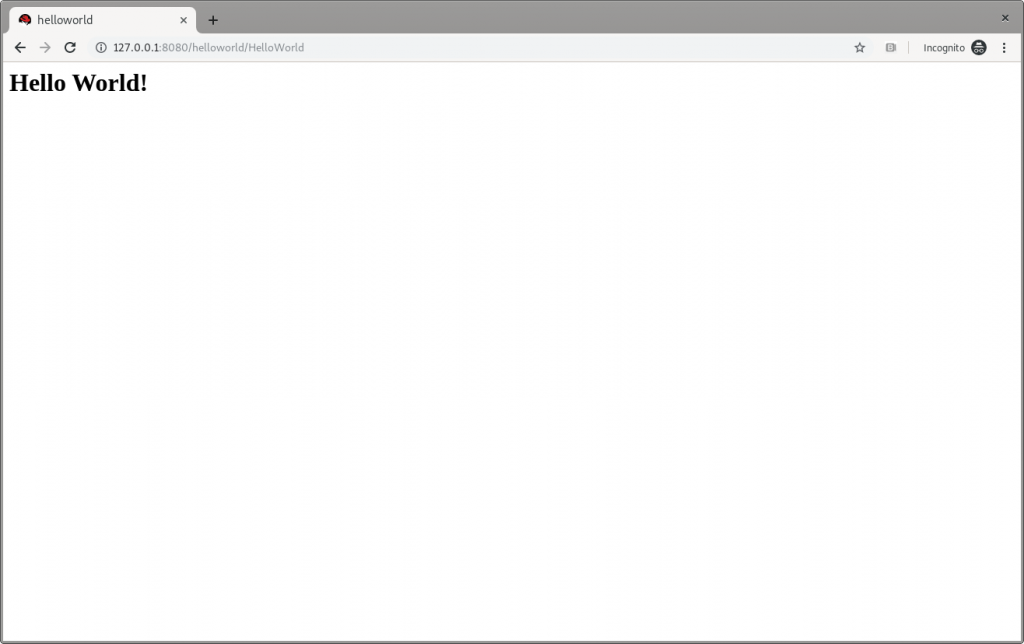
JBoss EAP's Hello World.

Figure 2: JBoss EAP’s Hello World.

Make changes

Change the createHelloMessage(String name) input parameter from World to Marco (my ego is cheap):

writer.println("<h1>" + helloService.createHelloMessage("Marco") + "</h1>");

Execute again the command:

$ mvn clean install wildfly:deploy 

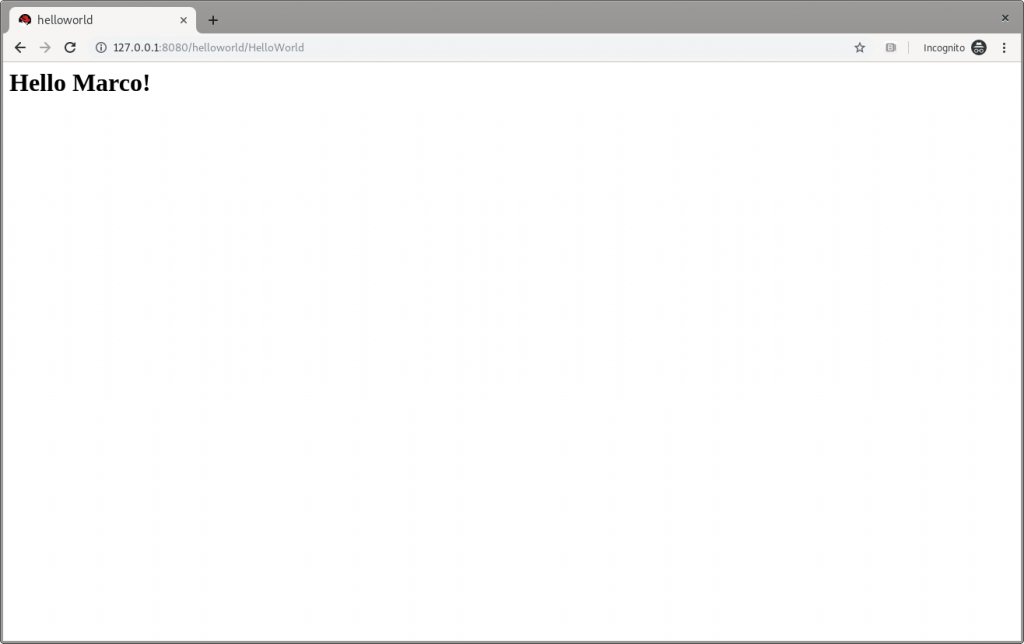
and then refresh the web page in the browser to check the message displayed changes, as shown in Figure 3:
JBoss EAP's Hello Marco.

Figure 3: JBoss EAP’s Hello Marco.

Undeploy helloworld and shut down

If you want to undeploy (optional) the application before shutting down JBoss EAP, run the following command:

$ mvn clean install wildfly:undeploy 

To shut down the JBoss EAP instance, enter Ctrl+C in the terminal where it’s running.

Let’s modernize helloworld

Now we can leave the original helloworld behind and update it.

Create a new branch

Create a new working branch once the quickstart project finishes executing:

$ git checkout -b quarkus 7.2.0.GA 

Change the pom.xml file

The time has come to start changing the application. starting from the pom.xml file. From the helloworld folder, run the following command to let Quarkus add XML blocks:

$ mvn io.quarkus:quarkus-maven-plugin:0.23.2:create 

This article uses the 0.23.2 version. To know which is the latest version is, please refer to https://github.com/quarkusio/quarkus/releases/latest/, since the Quarkus release cycles are short.

This command changed the pom.xml, file adding:

  • The property <quarkus.version> to define the Quarkus version to be used.
  • The <dependencyManagement> block to import the Quarkus bill of materials (BOM). In this way, there’s no need to add the version to each Quarkus dependency.
  • The quarkus-maven-plugin plugin responsible for packaging the application, and also providing the development mode.
  • The native profile to create application native executables.

Further changes required to pom.xml, to be done manually:

  1. Move the <groupId> tag outside of the <parent> block, and above the <artifactId> tag. Because we remove the <parent> block in the next step, the <groupId> must be preserved.
  2. Remove the <parent> block: The application doesn’t need the JBoss parent pom anymore to run with Quarkus.
  3. Add the <version> tag (below the <artifactId> tag) with the value you prefer.
  4. Remove the <packaging> tag: The application won’t be a WAR anymore, but a plain JAR.
  5. Change the following dependencies:
    1. Replace the javax.enterprise:cdi-api dependency with io.quarkus:quarkus-arc, removing <scope>provided</scope> because—as stated in the documentation—this Quarkus extension provides the CDI dependency injection.
    2. Replace the org.jboss.spec.javax.servlet:jboss-servlet-api_4.0_spec dependency with io.quarkus:quarkus-undertow, removing the <scope>provided</scope>, because—again as stated in the documentation—this is the Quarkus extension that provides support for servlets.
    3. Remove the org.jboss.spec.javax.annotation:jboss-annotations-api_1.3_spec dependency because it’s coming with the previously changed dependencies.

The pom.xml file’s fully changed version is available at https://github.com/mrizzi/jboss-eap-quickstarts/blob/quarkus/helloworld/pom.xml.

Note that the above mvn io.quarkus:quarkus-maven-plugin:0.23.2:create command, besides the changes to the pom.xml file, added components to the project. The added file and folders are:

  • The files mvnw and mvnw.cmd, and .mvn folder: The Maven Wrapper allows you to run Maven projects with a specific version of Maven without requiring that you install that specific Maven version.
  • The docker folder (in src/main/): This folder contains example Dockerfile files for both native and jvm modes (together with a .dockerignore file).
  • The resources folder (in src/main/): This folder contains an empty application.properties file and the sample Quarkus landing page index.html (more in the section “Run the modernized helloworld“).

Run helloworld

To test the application, use quarkus:dev, which runs Quarkus in development mode (more details on Development Mode here).

Note: We expect this step to fail as changes are still required to the application, as detailed in this section.

Now run the command to check if and how it works:

$ ./mvnw compile quarkus:dev [INFO] Scanning for projects... [INFO] [INFO] ----------------< org.jboss.eap.quickstarts:helloworld >---------------- [INFO] Building Quickstart: helloworld quarkus [INFO] --------------------------------[ war ]--------------------------------- [INFO] [INFO] --- maven-resources-plugin:2.6:resources (default-resources) @ helloworld --- [INFO] Using 'UTF-8' encoding to copy filtered resources. [INFO] Copying 2 resources [INFO] [INFO] --- maven-compiler-plugin:3.1:compile (default-compile) @ helloworld --- [INFO] Nothing to compile - all classes are up to date [INFO] [INFO] --- quarkus-maven-plugin:0.23.2:dev (default-cli) @ helloworld --- Listening for transport dt_socket at address: 5005 INFO [io.qua.dep.QuarkusAugmentor] Beginning quarkus augmentation INFO [org.jbo.threads] JBoss Threads version 3.0.0.Final ERROR [io.qua.dev.DevModeMain] Failed to start quarkus: java.lang.RuntimeException: io.quarkus.builder.BuildException: Build failure: Build failed due to errors [error]: Build step io.quarkus.arc.deployment.ArcProcessor#validate threw an exception: javax.enterprise.inject.spi.DeploymentException: javax.enterprise.inject.UnsatisfiedResolutionException: Unsatisfied dependency for type org.jboss.as.quickstarts.helloworld.HelloService and qualifiers [@Default] - java member: org.jboss.as.quickstarts.helloworld.HelloWorldServlet#helloService - declared on CLASS bean [types=[javax.servlet.ServletConfig, java.io.Serializable, org.jboss.as.quickstarts.helloworld.HelloWorldServlet, javax.servlet.GenericServlet, javax.servlet.Servlet, java.lang.Object, javax.servlet.http.HttpServlet], qualifiers=[@Default, @Any], target=org.jboss.as.quickstarts.helloworld.HelloWorldServlet] at io.quarkus.arc.processor.BeanDeployment.processErrors(BeanDeployment.java:841) at io.quarkus.arc.processor.BeanDeployment.init(BeanDeployment.java:214) at io.quarkus.arc.processor.BeanProcessor.initialize(BeanProcessor.java:106) at io.quarkus.arc.deployment.ArcProcessor.validate(ArcProcessor.java:249) at sun.reflect.NativeMethodAccessorImpl.invoke0(Native Method) at sun.reflect.NativeMethodAccessorImpl.invoke(NativeMethodAccessorImpl.java:62) at sun.reflect.DelegatingMethodAccessorImpl.invoke(DelegatingMethodAccessorImpl.java:43) at java.lang.reflect.Method.invoke(Method.java:498) at io.quarkus.deployment.ExtensionLoader$1.execute(ExtensionLoader.java:780) at io.quarkus.builder.BuildContext.run(BuildContext.java:415) at org.jboss.threads.ContextClassLoaderSavingRunnable.run(ContextClassLoaderSavingRunnable.java:35) at org.jboss.threads.EnhancedQueueExecutor.safeRun(EnhancedQueueExecutor.java:2011) at org.jboss.threads.EnhancedQueueExecutor$ThreadBody.doRunTask(EnhancedQueueExecutor.java:1535) at org.jboss.threads.EnhancedQueueExecutor$ThreadBody.run(EnhancedQueueExecutor.java:1426) at java.lang.Thread.run(Thread.java:748) at org.jboss.threads.JBossThread.run(JBossThread.java:479) Caused by: javax.enterprise.inject.UnsatisfiedResolutionException: Unsatisfied dependency for type org.jboss.as.quickstarts.helloworld.HelloService and qualifiers [@Default] - java member: org.jboss.as.quickstarts.helloworld.HelloWorldServlet#helloService - declared on CLASS bean [types=[javax.servlet.ServletConfig, java.io.Serializable, org.jboss.as.quickstarts.helloworld.HelloWorldServlet, javax.servlet.GenericServlet, javax.servlet.Servlet, java.lang.Object, javax.servlet.http.HttpServlet], qualifiers=[@Default, @Any], target=org.jboss.as.quickstarts.helloworld.HelloWorldServlet] at io.quarkus.arc.processor.Beans.resolveInjectionPoint(Beans.java:428) at io.quarkus.arc.processor.BeanInfo.init(BeanInfo.java:371) at io.quarkus.arc.processor.BeanDeployment.init(BeanDeployment.java:206) ... 14 more 

It failed. Why? What happened?

The UnsatisfiedResolutionException exception refers to the HelloService class, which is a member of the HelloWorldServlet class (java member: org.jboss.as.quickstarts.helloworld.HelloWorldServlet#helloService). The problem is that HelloWorldServlet needs an injected instance of HelloService, but it can not be found (even if the two classes are in the very same package).

It’s time to return to Quarkus guides to leverage the documentation and understand how @Inject—and hence Contexts and Dependency Injection (CDI)—works in Quarkus, thanks to the Contexts and Dependency Injection guide. In the Bean Discovery paragraph, it says, “Bean classes that don’t have a bean defining annotation are not discovered.”

Looking at the HelloService class, it’s clear there’s no bean defining annotation, and one has to be added to have Quarkus to discover the bean. So, because it’s a stateless object, it’s safe to add the @ApplicationScoped annotation:

@ApplicationScoped public class HelloService { 

Note: The IDE should prompt you to add the required package shown here (add it manually if need be):

import javax.enterprise.context.ApplicationScoped; 

If you’re in doubt about which scope to apply when the original bean has no scope defined, please refer to the JSR 365: Contexts and Dependency Injection for Java 2.0—Default scope documentation.

Now, try again to run the application, executing again the ./mvnw compile quarkus:dev command:

$ ./mvnw compile quarkus:dev [INFO] Scanning for projects... [INFO] [INFO] ----------------< org.jboss.eap.quickstarts:helloworld >---------------- [INFO] Building Quickstart: helloworld quarkus [INFO] --------------------------------[ war ]--------------------------------- [INFO] [INFO] --- maven-resources-plugin:2.6:resources (default-resources) @ helloworld --- [INFO] Using 'UTF-8' encoding to copy filtered resources. [INFO] Copying 2 resources [INFO] [INFO] --- maven-compiler-plugin:3.1:compile (default-compile) @ helloworld --- [INFO] Changes detected - recompiling the module! [INFO] Compiling 2 source files to /home/mrizzi/git/forked/jboss-eap-quickstarts/helloworld/target/classes [INFO] [INFO] --- quarkus-maven-plugin:0.23.2:dev (default-cli) @ helloworld --- Listening for transport dt_socket at address: 5005 INFO [io.qua.dep.QuarkusAugmentor] (main) Beginning quarkus augmentation INFO [io.qua.dep.QuarkusAugmentor] (main) Quarkus augmentation completed in 576ms INFO [io.quarkus] (main) Quarkus 0.23.2 started in 1.083s. Listening on: http://0.0.0.0:8080 INFO [io.quarkus] (main) Profile dev activated. Live Coding activated. INFO [io.quarkus] (main) Installed features: [cdi] 

This time the application runs successfully.

Run the modernized helloworld

As the terminal log suggests, open a browser to http://0.0.0.0:8080(the default Quarkus landing page), and the page shown in Figure 4 appears:
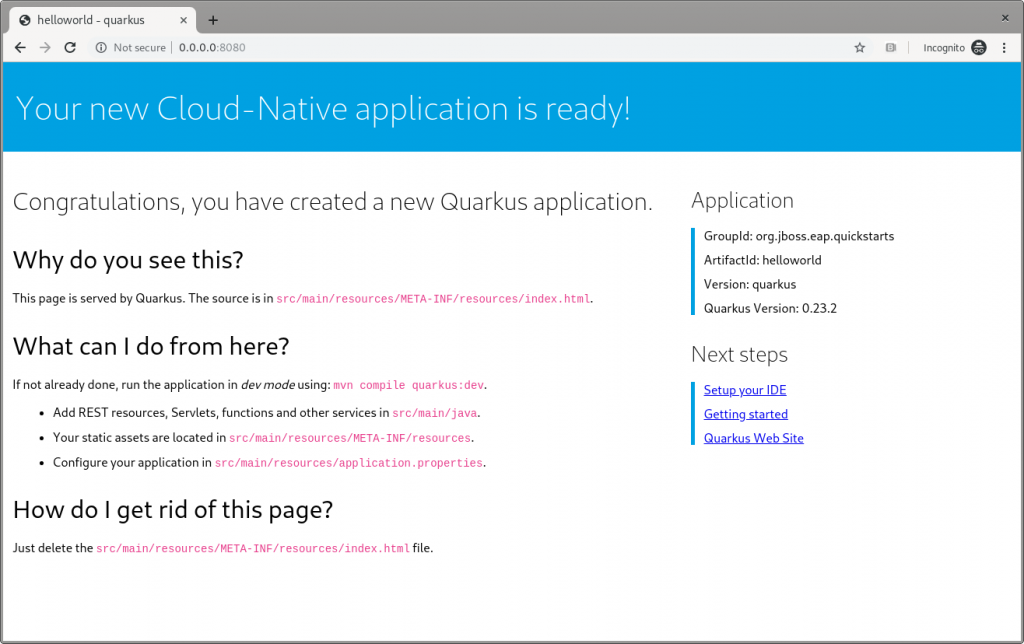
The Quarkus dev landing page.

Figure 4: The Quarkus dev landing page.

This application has the following context’s definition in the WebServlet annotation:

@WebServlet("/HelloWorld") public class HelloWorldServlet extends HttpServlet { 

Hence, you can browse to http://0.0.0.0:8080/HelloWorldto reach the page shown in Figure 5:
The Quarkus dev Hello World page.

Figure 5: The Quarkus dev Hello World page.

It works!

Make changes

Please, pay attention to the fact that the ./mvnw compile quarkus:dev command is still running, and we’re not going to stop it. Now, try to apply the same—very trivial—change to the code and see how Quarkus improves the developer experience:

writer.println("<h1>" + helloService.createHelloMessage("Marco") + "</h1>");

Save the file, and then refresh the web page to check that Hello Marco appears, as shown in Figure 6:
The Quarkus dev Hello Marco page.

Figure 6: The Quarkus dev Hello Marco page.

Take time to check the terminal output:

INFO [io.qua.dev] (vert.x-worker-thread-3) Changed source files detected, recompiling [/home/mrizzi/git/forked/jboss-eap-quickstarts/helloworld/src/main/java/org/jboss/as/quickstarts/helloworld/HelloWorldServlet.java] INFO [io.quarkus] (vert.x-worker-thread-3) Quarkus stopped in 0.003s INFO [io.qua.dep.QuarkusAugmentor] (vert.x-worker-thread-3) Beginning quarkus augmentation INFO [io.qua.dep.QuarkusAugmentor] (vert.x-worker-thread-3) Quarkus augmentation completed in 232ms INFO [io.quarkus] (vert.x-worker-thread-3) Quarkus 0.23.2 started in 0.257s. Listening on: http://0.0.0.0:8080 INFO [io.quarkus] (vert.x-worker-thread-3) Profile dev activated. Live Coding activated. INFO [io.quarkus] (vert.x-worker-thread-3) Installed features: [cdi] INFO [io.qua.dev] (vert.x-worker-thread-3) Hot replace total time: 0.371s 

Refreshing the page triggered the source code change detection and the Quarkus automagic “stop-and-start.” All of this executed in just 0.371 seconds (that’s part of the Quarkus “Supersonic Subatomic Java” experience).

Build the helloworld packaged JAR

Now that the code works as expected, it can be packaged using the command:

$ ./mvnw clean package

This command creates two JARs in the /target folder. The first is helloworld-<version>.jar, which is the standard artifact built from the Maven command with the project’s classes and resources. The second is helloworld-<version>-runner.jar, which is an executable JAR.

Please pay attention to the fact that this is not an uber-jar, because all of the dependencies are copied into the /target/lib folder (and not bundled within the JAR). Hence, to run this JAR in another location or host, both the JAR file and the libraries in the /lib folder have to be copied, considering that the Class-Path entry of the MANIFEST.MF file in the JAR explicitly lists the JARs from the lib folder.

To create an uber-jar application, please refer to the Uber-Jar Creation Quarkus guide.

Run the helloworld packaged JAR

Now, the packaged JAR can be executed using the standard java command:

$ java -jar ./target/helloworld-<version>-runner.jar INFO [io.quarkus] (main) Quarkus 0.23.2 started in 0.673s. Listening on: http://0.0.0.0:8080 INFO [io.quarkus] (main) Profile prod activated. INFO [io.quarkus] (main) Installed features: [cdi] 

As done above, open the http://0.0.0.0:8080 URL in a browser, and test that everything works.

Build the helloworld quickstart-native executable

So far so good. The helloworld quickstart ran as a standalone Java application using Quarkus dependencies, but more can be achieved by adding a further step to the modernization path: Build a native executable.

Install GraalVM

First of all, the tools for creating the native executable have to be installed:

  1. Download GraalVM 19.2.0.1 from https://github.com/oracle/graal/releases/tag/vm-19.2.0.1.
  2. Untar the file using the command:

$ tar xvzf graalvm-ce-linux-amd64-19.2.0.1.tar.gz

  1. Go to the untar folder.
  2. Execute the following to download and add the native image component:

$ ./bin/gu install native-image

  1. Set the GRAALVM_HOME environment variable to the folder created in step two, for example:

$ export GRAALVM_HOME={untar-folder}/graalvm-ce-19.2.0.1)

More details and install instructions for other operating systems are available in Building a Native Executable—Prerequisites Quarkus guide.

Build the helloworld native executable

As stated in the Building a Native Executable—Producing a native executable Quarkus guide, “Let’s now produce a native executable for our application. It improves the startup time of the application and produces a minimal disk footprint. The executable would have everything to run the application including the ‘JVM’ (shrunk to be just enough to run the application), and the application.”

To create the native executable, the Maven native profile has to be enabled by executing:

$ ./mvnw package -Pnative

The build took me about 1:10 minutes and the result is the helloworld-<version>-runner file in the /target folder.

Run the helloworld native executable

The /target/helloworld-<version>-runner file created in the previous step. It’s executable, so running it is easy:

$ ./target/helloworld-<version>-runner INFO [io.quarkus] (main) Quarkus 0.23.2 started in 0.006s. Listening on: http://0.0.0.0:8080 INFO [io.quarkus] (main) Profile prod activated. INFO [io.quarkus] (main) Installed features: [cdi] 

As done before, open the http://0.0.0.0:8080 URL in a browser and test that everything is working.

Next steps

I believe that this modernization, even of a basic application, is the right way to approach a brownfield application using technologies available in Quarkus. This way, you can start facing the issues and tackling them to understand and learn how to solve them.

In part two of this series, I’ll look at how to capture memory consumption data in order to evaluate performance improvements, which is a fundamental part of the modernization process.

Share

The post Quarkus: Modernize “helloworld” JBoss EAP quickstart, Part 1 appeared first on Red Hat Developer.