Hit Mystery Film Knives Out Is Officially Getting A Sequel
Fans of Daniel Craig and ludicrous Southern accents rejoice: Rian Johnson's critically-acclaimed whodunit is getting a follow-up. Lionsgate CEO Jon Feltheimer announced the sequel as part of the company's third-quarter earnings call. The film picked up critical buzz following its release late last year, which has translated into a strong box-office performance, with a worldwide gross quickly approaching the $300 million mark.
Best-known for directing the sharply-divisive Star Wars entry The Last Jedi, Johnson had already indicated in interviews that he wanted to make a follow-up to Knives Out, with Craig's gentlemen detective Benoit Blanc taking on a new case. Feltheimer also hinted that Lionsgate feels that the film has franchise potential.
In our Knives Out review, Rafael Motamayor praised the movie as a "razor-sharp deconstruction of the whodunit genre." The film isn't Johnson's only foray into the genre--his directorial debut Brick played with the conventions of mystery fiction, with a more hard-boiled twist. As for Craig, you can see him in the upcoming Bond flick No Time to Die, which comes to theatres in April.
SoulCalibur VI Producer Still Not Sure About Porting The Game To Switch
The Switch is home of many fighting games, but one series that hasn’t been released on the hybrid platform yet is Bandai Namco’s SoulCalibur series. Last year, SoulCalibur VI producer Motohiro Okubo said he was open to the idea of the new entry coming to the Switch, if it was possible, and now in a more recent interview with the SoulCailburCommunity he’s revealed the situation hasn’t really changed:
If I have to answer seriously, I think I remember telling you previously that we’re not sure we can port the game to Nintendo Switch. I said we have to examine and look into that, and well… When I said that, I didn’t know if we’d have a Season 2 yet and now that we have one, I’ll be totally honest by saying we didn’t have time to look into that. So basically, the situation hasn’t changed much.
Here’s his previous response, in the interview dating back to August 2018:
At the moment there is no development for Switch at all. I understand that the Switch is a very successful hardware, and of course if there is a possibility, then it would be great to do it.
The last SoulCalibur game released on a Nintendo platform was SoulCalibur Legends in 2007 for the Wii. Before then there was SoulCalibur II on the GameCube, featuring the exclusive fighter Link from The Legend of Zelda series. Would you like to see the latest SoulCalibur game come to Switch? Leave a comment below.
Posted by: xSicKxBot - 02-09-2020, 10:57 AM - Forum: Lounge
- No Replies
Diablo 3 PTR Patch With New Class Sets Now Available
Diablo 3 has released its latest patch for public testing, letting you dabble with some new class sets. If you're in the public test realm on PC, you can try out the new sets for Barbarian, Witch Doctor, and Wizard, among other changes in the 2.6.8 update.
Barbarian's "Horde of Ninety Savages" class set boosts Frenzy, the Witch Doctor gets "Mundunugu's Regalia" to change its Spirit Barrage ability, and the Wizard's "Typhon's Veil" maks changes to the Hydra ability. Blizzard also noted that it added extra Legendaries to round out the new builds. If you want to help test the new sets, Blizzard recommends focusing on one during the limited time, rather than trying to dabble in all three.
In addition to these class sets, the patch is introducing a new Season 20 Theme, Season of the Forbidden Archives. That theme will be accompanied by a revised Kanai's Cube that removes many of its usual restrictions. The focus is on letting players boost their own power level rather than focus on environmental effects. Playing Season 20 will earn a new pet and portrait frame.
Blizzard has been updating Diablo 3 regularly with new class sets, updates, and other items to collect, along with seasonal challenges. Meanwhile, the company is working on Diablo 4, and just brought in a notable name to help steer the Diablo franchise: former Gears of War head Rod Fergusson.
Diablo 3 PTR Patch 2.68
General
Infernal Machines and Organs are now subject to vacuum pick-up
Crafting plans from Bounty Caches are now guaranteed to drop unless all plans have been learned
Seasons
A new Season Theme has been added for Season 20, the Season of the Forbidden Archives:
For the duration of Season 20, all slots in Kanai's Cube will be able to select Legendary powers from Weapon, Armor, or Jewelry
This means you could select three Armor powers, three Weapon powers, three Jewelery powers, or any other combination thereof across all categories
Items are not self-additive or multiplicative (meaning, you cannot stack multiples of the same item's power)
Once the Season has ended and characters roll over to Non-Season, players will have all currently active powers in their Kanai's Cube reset
Developer's Note: As we outlined in our Developer Insight blog, we want to continue to get creative (and maybe a little crazy) with the Season Themes and powers we add to the game. We heard from some players that they preferred themes that made your character directly feel more powerful rather than needing to focus on the environment around you. If that describes you, then the Season of Forbidden Archives should be right up your alley, and we're really interested to see how this changes the game for Season 20.
Two new Seasonal rewards are available for players who fully complete the Season 20 Journey, including a new portrait frame and pet
Classes
Crusader
Heaven's Fury
The animation for the Fires of Heaven rune can no longer be cancelled early.
Items
Developer's Note: With Patch 2.6.8, we're adding three(!) new class sets with similar goals to those we included in the previous patch. Each set was designed primarily with boosting long-requested skills and play styles we lifted directly from community feedback. Frenzy, Spirit Barrage, and Hydra were requests that offered a lot of opportunity for gameplay exploration, and we're looking forward to seeing what players do with these new tools at their disposal. Additional changes to associated supplemental Legendaries have been included to round out these builds. It is critical when providing feedback on these sets to include whether or not you were using the Season 20 buff during your testing; while feedback of any kind is welcome, we're especially interested in Non-Seasonal testing as that will better reflect the long-term performance of these sets.
Mantle of Channeling
The bonus granted by this item now occurs 1 second after channeling has begun
Barbarian
New Class Set: Horde of the Ninety Savages
2-Piece Bonus: Double the effectiveness of all Shouts. Feared Enemies take double damage.
4-Piece Bonus: Each stack of Frenzy reduces damage taken by 5%.
6-Piece Bonus: Frenzy deals 1000% increased damage per stack.
Undisputed Champion
Frenzy gains the effect of every rune and deals 300-400% increased damage.
Bastion's Revered
Frenzy now stacks up to 10 times and hits an additional time per attack. Each additional hit will chain to any enemies within 15 yards and the damage is split between all affected enemies.
Witch Doctor
New Class Set: Mundunugu's Regalia
2-Piece Bonus: Big Bad Voodoo now follows you and lasts twice as long.
4-Piece Bonus: Gain 50% damage reduction for 30 seconds when you enter the Spirit Realm.
6-Piece Bonus: Spirit Barrage deals increased damage equal to 50 times your Mana Regeneration per Second.
The Barber
Instead of dealing direct damage, your Spirit Barrage now accumulates on the target. When you stop casting, it explodes dealing 225-250% 400-500% of the accumulated damage to all enemies within 15 yards.
Gazing Demise
Spirit Barrage gains the Phantasm rune. Each active Phantasm lasts twice as long, increases the damage of Spirit Barrage by 40-50% 100-150%, and also increases the attack rate from Manitou spectres.
Now always rolls with Critical Hit Chance instead of Life Per Second.
Wizard
New Class Set: The Typhon's Veil
2-Piece Bonus: Double the duration of Hydras and increase the number of heads on multi-headed Hydras by two.
4-Piece Bonus: Damage taken is reduced by 8% for each Hydra head alive as long as there is one available. Each time you take damage, a Hydra heads dies.
6-Piece Bonus: Hydras deal 1000% increased damage for each Hydra head alive.
Serpent's Sparker
You may have one extra Hydra active at a time and they deal 450-600% increased damage.
The Magistrate
Frost Hydra Your Hydras now periodically casts Frost Nova and deal 450-600% increased damage.
Etched Sigil
The bonus granted by this item now occurs 1 second after channeling has begun.
Deathwish
The bonus granted by this item now occurs 1 second after channeling has begun.
Bugs
Several issues with adding/removing players to group and starting new games as a group have been resolved
Captain Crimson's Trimmings
Fixed an issue where the set bonus did not increase damage reduction when using Devour - Voracious
Crusader
Corrected the spelling of “Imperius” on the flavor text for several pieces of the Aegis of Valor set
Fixed an issue where the bolts cast by Fist of the Heavens - Divine Well failed to zap enemies
Posted by: xSicKxBot - 02-09-2020, 03:51 AM - Forum: Python
- No Replies
Matplotlib Subplots – A Helpful Illustrated Guide
Too much stuff happening in a single plot? No problem—use multiple subplots!
This in-depth tutorial shows you everything you need to know to get started with Matplotlib’s subplots() function.
If you want, just hit “play” and watch the explainer video. I’ll then guide you through the tutorial:
Let’s start with the short answer on how to use it—you’ll learn all the details later!
The plt.subplots() function creates a Figure and a Numpy array of Subplot/Axes objects which you store in fig and axes respectively.
Specify the number of rows and columns you want with the nrows and ncols arguments.
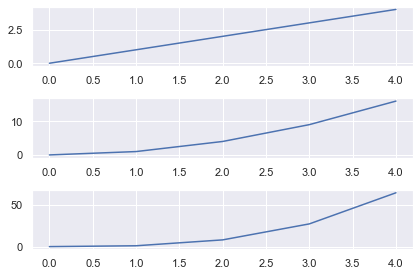
fig, axes = plt.subplots(nrows=3, ncols=1)
This creates a Figure and Subplots in a 3×1 grid. The Numpy array axes has shape (nrows, ncols) the same shape as the grid, in this case (3,) (it’s a 1D array since one of nrows or ncols is 1). Access each Subplot using Numpy slice notation and call the plot() method to plot a line graph.
Once all Subplots have been plotted, call plt.tight_layout() to ensure no parts of the plots overlap. Finally, call plt.show() to display your plot.
# Import necessary modules and (optionally) set Seaborn style

import matplotlib.pyplot as plt

import seaborn as sns; sns.set()

import numpy as np # Generate data to plot

linear = [x for x in range(5)]

square = [x**2 for x in range(5)]

cube = [x**3 for x in range(5)] # Generate Figure object and Axes object with shape 3x1

fig, axes = plt.subplots(nrows=3, ncols=1) # Access first Subplot and plot linear numbers

axes[0].plot(linear) # Access second Subplot and plot square numbers

axes[1].plot(square) # Access third Subplot and plot cube numbers

axes[2].plot(cube) plt.tight_layout()

plt.show()
Matplotlib Figures and Axes
Up until now, you have probably made all your plots with the functions in matplotlib.pyplot i.e. all the functions that start with plt..
These work nicely when you draw one plot at a time. But to draw multiple plots on one Figure, you need to learn the underlying classes in matplotlib.
Let’s look at an image that explains the main classes from the AnatomyOfMatplotlib tutorial:
To quote AnatomyOfMatplotlib:
The Figure is the top-level container in this hierarchy. It is the overall window/page that everything is drawn on. You can have multiple independent figures and Figures can contain multiple Axes.
Most plotting ocurs on an Axes. The axes is effectively the area that we plot data on and any ticks/labels/etc associated with it. Usually we’ll set up an Axes with a call to subplots (which places Axes on a regular grid), so in most cases, Axes and Subplot are synonymous.
Each Axes has an XAxis and a YAxis. These contain the ticks, tick locations, labels, etc. In this tutorial, we’ll mostly control ticks, tick labels, and data limits through other mechanisms, so we won’t touch the individual Axis part of things all that much. However, it is worth mentioning here to explain where the term Axes comes from.
The typical variable names for each object are:
Figure – fig or f,
Axes (plural) – axes or axs,
Axes (singular) – ax or a
The word Axes refers to the area you plot on and is synonymous with Subplot. However, you can have multiple Axes (Subplots) on a Figure. In speech and writing use the same word for the singular and plural form. In your code, you should make a distinction between each – you plot on a singular Axes but will store all the Axes in a Numpy array.
An Axis refers to the XAxis or YAxis – the part that gets ticks and labels.
The pyplot module implicitly works on one Figure and one Axes at a time. When we work with Subplots, we work with multiple Axes on one Figure. So, it makes sense to plot with respect to the Axes and it is much easier to keep track of everything.
The main differences between using Axes methods and pyplot are:
Always create a Figure and Axes objects on the first line
To plot, write ax.plot() instead of plt.plot().
Once you get the hang of this, you won’t want to go back to using pyplot. It’s much easier to create interesting and engaging plots this way. In fact, this is why most StackOverflow answers are written with this syntax.
All of the functions in pyplot have a corresponding method that you can call on Axes objects, so you don’t have to learn any new functions.
Let’s get to it.
Matplotlib Subplots Example
The plt.subplots() function creates a Figure and a Numpy array of Subplots/Axes objects which we store in fig and axes respectively.
Specify the number of rows and columns you want with the nrows and ncols arguments.
fig, axes = plt.subplots(nrows=3, ncols=1)
This creates a Figure and Subplots in a 3×1 grid. The Numpy array axes is the same shape as the grid, in this case (3,). Access each Subplot using Numpy slice notation and call the plot() method to plot a line graph.
Once all Subplots have been plotted, call plt.tight_layout() to ensure no parts of the plots overlap. Finally, call plt.show() to display your plot.
The most important arguments for plt.subplots() are similar to the matplotlib subplot function but can be specified with keywords. Plus, there are more powerful ones which we will discuss later.
To create a Figure with one Axes object, call it without any arguments
fig, ax = plt.subplots()
Note: this is implicitly called whenever you use the pyplot module. All ‘normal’ plots contain one Figure and one Axes.
In advanced blog posts and StackOverflow answers, you will see a line similar to this at the top of the code. It is much more Pythonic to create your plots with respect to a Figure and Axes.
To create a Grid of subplots, specify nrows and ncols – the number of rows and columns respectively
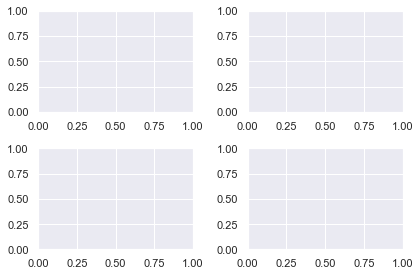
fig, axes = plt.subplots(nrows=2, ncols=2)
The variable axes is a numpy array with shape (nrows, ncols). Note that it is in the plural form to indicate it contains more than one Axes object. Another common name is axs. Choose whichever you prefer. If you call plt.subplots() without an argument name the variable ax as there is only one Axes object returned.
I will select each Axes object with slicing notation and plot using the appropriate methods. Since I am using Numpy slicing, the index of the first Axes is 0, not 1.
# Create Figure and 2x2 gris of Axes objects

fig, axes = plt.subplots(nrows=2, ncols=2) # Generate data to plot. data = np.array([1, 2, 3, 4, 5]) # Access Axes object with Numpy slicing then plot different distributions

axes[0, 0].plot(data)

axes[0, 1].plot(data**2)

axes[1, 0].plot(data**3)

axes[1, 1].plot(np.log(data)) plt.tight_layout()

plt.show()
First I import the necessary modules, then create the Figure and Axes objects using plt.subplots(). The Axes object is a Numpy array with shape (2, 2) and I access each subplot via Numpy slicing before doing a line plot of the data. Then, I call plt.tight_layout() to ensure the axis labels don’t overlap with the plots themselves. Finally, I call plt.show() as you do at the end of all matplotlib plots.
Matplotlib Subplots Title
To add an overall title to the Figure, use plt.suptitle().
To add a title to each Axes, you have two methods to choose from:
ax.set_title('bar')
ax.set(title='bar')
In general, you can set anything you want on an Axes using either of these methods. I recommend using ax.set() because you can pass any setter function to it as a keyword argument. This is faster to type, takes up fewer lines of code and is easier to read.
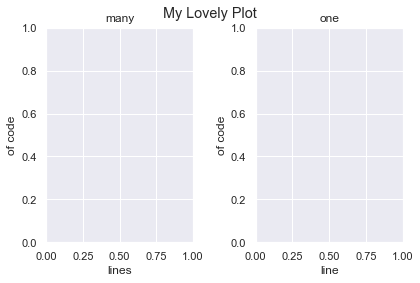
Let’s set the title, xlabel and ylabel for two Subplots using both methods for comparison
# Unpack the Axes object in one line instead of using slice notation

fig, (ax1, ax2) = plt.subplots(nrows=1, ncols=2) # First plot - 3 lines

ax1.set_title('many')

ax1.set_xlabel('lines')

ax1.set_ylabel('of code') # Second plot - 1 line

ax2.set(title='one', xlabel='line', ylabel='of code') # Overall title

plt.suptitle('My Lovely Plot')

plt.tight_layout()

plt.show()
Clearly using ax.set() is the better choice.
Note that I unpacked the Axes object into individual variables on the first line. You can do this instead of Numpy slicing if you prefer. It is easy to do with 1D arrays. Once you create grids with multiple rows and columns, it’s easier to read if you don’t unpack them.
Matplotlib Subplots Share X Axis
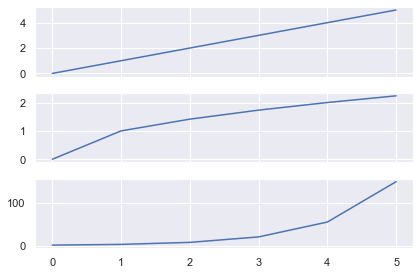
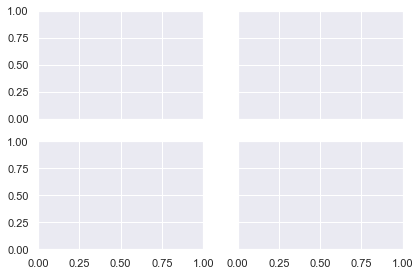
To share the x axis for subplots in matplotlib, set sharex=True in your plt.subplots() call.
# Generate data

data = [0, 1, 2, 3, 4, 5] # 3x1 grid that shares the x axis

fig, axes = plt.subplots(nrows=3, ncols=1, sharex=True) # 3 different plots

axes[0].plot(data)

axes[1].plot(np.sqrt(data))

axes[2].plot(np.exp(data)) plt.tight_layout()

plt.show()
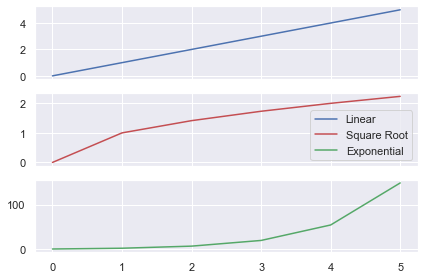
Here I created 3 line plots that show the linear, square root and exponential of the numbers 0-5.
As I used the same numbers, it makes sense to share the x-axis.
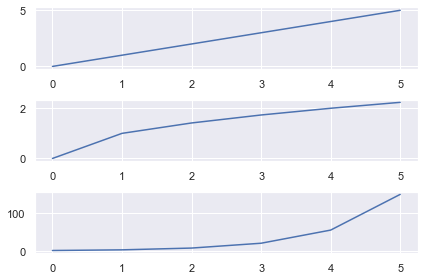
Here I wrote the same code but set sharex=False (the default behavior). Now there are unnecessary axis labels on the top 2 plots.
You can also share the y axis for plots by setting sharey=True in your plt.subplots() call.
Matplotlib Subplots Legend
To add a legend to each Axes, you must
Label it using the label keyword
Call ax.legend() on the Axes you want the legend to appear
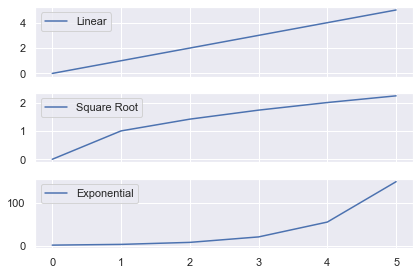
Let’s look at the same plot as above but add a legend to each Axes.
# Generate data, 3x1 plot with shared XAxis

data = [0, 1, 2, 3, 4, 5]

fig, axes = plt.subplots(nrows=3, ncols=1, sharex=True) # Plot the distributions and label each Axes

axes[0].plot(data, label='Linear')

axes[1].plot(np.sqrt(data), label='Square Root')

axes[2].plot(np.exp(data), label='Exponential') # Add a legend to each Axes with default values

for ax in axes: ax.legend() plt.tight_layout()

plt.show()
The legend now tells you which function has been applied to the data. I used a for loop to call ax.legend() on each of the Axes. I could have done it manually instead by writing:
Instead of having 3 legends, let’s just add one legend to the Figure that describes each line. Note that you need to change the color of each line, otherwise the legend will show three blue lines.
handles – the lines/plots you want to add to the legend (list)
labels – the labels you want to give each line (list)
Get the handles by storing the output of you ax.plot() calls in a list. You need to create the list of labels yourself. Then call legend() on the Axes you want to add the legend to.
# Generate data and 3x1 grid with a shared x axis

data = [0, 1, 2, 3, 4, 5]

fig, axes = plt.subplots(nrows=3, ncols=1, sharex=True) # Store the output of our plot calls to use as handles

# Plot returns a list of length 1, so unpack it using a comma

linear, = axes[0].plot(data, 'b')

sqrt, = axes[1].plot(np.sqrt(data), 'r')

exp, = axes[2].plot(np.exp(data), 'g') # Create handles and labels for the legend

handles = [linear, sqrt, exp]

labels = ['Linear', 'Square Root', 'Exponential'] # Draw legend on first Axes

axes[0].legend(handles, labels) plt.tight_layout()

plt.show()
First I generated the data and a 3×1 grid. Then I made three ax.plot() calls and applied different functions to the data.
Note that ax.plot() returns a list of matplotlib.line.Line2D objects. You have to pass these Line2D objects to ax.legend() and so need to unpack them first.
Standard unpacking syntax in Python is:
a, b = [1, 2]

# a = 1, b = 2
However, each ax.plot() call returns a list of length 1. To unpack these lists, write
x, = [5]

# x = 5
If you just wrote x = [5] then x would be a list and not the object inside the list.
After the plot() calls, I created 2 lists of handles and labels which I passed to axes[0].legend() to draw it on the first plot.
In the above plot, I changed thelegend call to axes[1].legend(handles, labels) to plot it on the second (middle) Axes.
Matplotlib Subplots Size
You have total control over the size of subplots in matplotlib.
You can either change the size of the entire Figure or the size of the Subplots themselves.
First, let’s look at changing the Figure.
Matplotlib Figure Size
If you are happy with the size of your subplots but you want the final image to be larger/smaller, change the Figure.
If you’ve read my article on the matplotlib subplot function, you know to use the plt.figure() function to to change the Figure. Fortunately, any arguments passed to plt.subplots() are also passed to plt.figure(). So, you don’t have to add any extra lines of code, just keyword arguments.
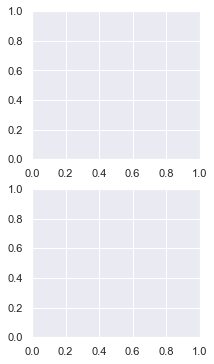
I created a 2×1 plot and set the Figure size with the figsize argument. It accepts a tuple of 2 numbers – the (width, height) of the image in inches.
So, I created a plot 3 inches wide and 6 inches long – figsize=(3, 6).
# 2x1 grid - twice as long as it is wide

fig, axes = plt.subplots(nrows=2, ncols=1, figsize=plt.figaspect(2))

plt.show()
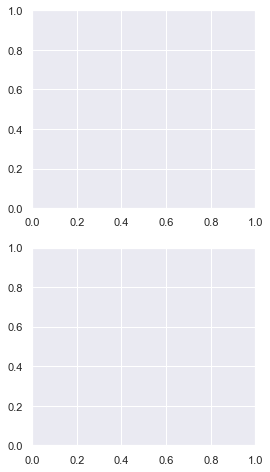
You can set a more general Figure size with the matplotlib figaspect function. It lets you set the aspect ratio (height/width) of the Figure.
Above, I created a Figure twice as long as it is wide by setting figsize=plt.figaspect(2).
Note: Remember the aspect ratio (height/width) formula by recalling that height comes first in the alphabet before width.
Matplotlib Subplots Different Sizes
If you have used plt.subplot() before (I’ve written a whole tutorial on this too), you’ll know that the grids you create are limited. Each Subplot must be part of a regular grid i.e. of the form 1/x for some integer x. If you create a 2×1 grid, you have 2 rows and each row takes up 1/2 of the space. If you create a 3×2 grid, you have 6 subplots and each takes up 1/6 of the space.
Using plt.subplots() you can create a 2×1 plot with 2 rows that take up any fraction of space you want.
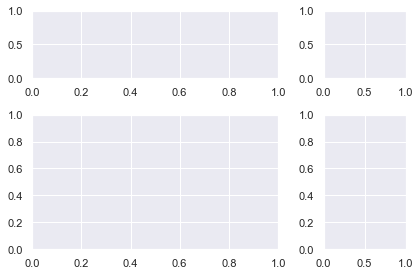
Let’s make a 2×1 plot where the top row takes up 1/3 of the space and the bottom takes up 2/3.
You do this by specifying the gridspec_kw argument and passing a dictionary of values. The main arguments we are interested in are width_ratios and height_ratios. They accept lists that specify the width ratios of columns and height ratios of the rows. In this example the top row is 1/3 of the Figure and the bottom is 2/3. Thus the height ratio is 1:2 or [1, 2] as a list.
# 2 x1 grid where top is 1/3 the size and bottom is 2/3 the size

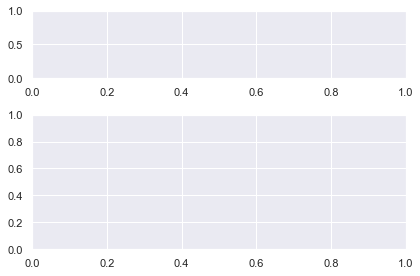
fig, axes = plt.subplots(nrows=2, ncols=1, gridspec_kw={'height_ratios': [1, 2]}) plt.tight_layout()

plt.show()
The only difference between this and a regular 2×1 plt.subplots() call is the gridspec_kw argument. It accepts a dictionary of values. These are passed to the matplotlib GridSpec constructor (the underlying class that creates the grid).
Let’s create a 2×2 plot with the same [1, 2] height ratios but let’s make the left hand column take up 3/4 of the space.
# Heights: Top row is 1/3, bottom is 2/3 --> [1, 2]

# Widths : Left column is 3/4, right is 1/4 --> [3, 1]

ratios = {'height_ratios': [1, 2], 'width_ratios': [3, 1]} fig, axes = plt.subplots(nrows=2, ncols=2, gridspec_kw=ratios) plt.tight_layout()

plt.show()
Everything is the same as the previous plot but now we have a 2×2 grid and have specified width_ratios. Since the left column takes up 3/4 of the space and the right takes up 1/4 the ratios are [3, 1].
Matplotlib Subplots Size
In the previous examples, there were white lines that cross over each other to separate the Subplots into a clear grid. But sometimes you will not have that to guide you. To create a more complex plot, you have to manually add Subplots to the grid.
You could do this using the plt.subplot() function. But since we are focusing on Figure and Axes notation in this article, I’ll show you how to do it another way.
You need to use the fig.add_subplot() method and it has the same notation as plt.subplot(). Since it is a Figure method, you first need to create one with the plt.figure() function.
fig = plt.figure()
<Figure size 432x288 with 0 Axes>
The hardest part of creating a Figure with different sized Subplots in matplotlib is figuring out what fraction of space each Subplot takes up.
So, it’s a good idea to know what you are aiming for before you start. You could sketch it on paper or draw shapes in PowerPoint. Once you’ve done this, everything else is much easier.
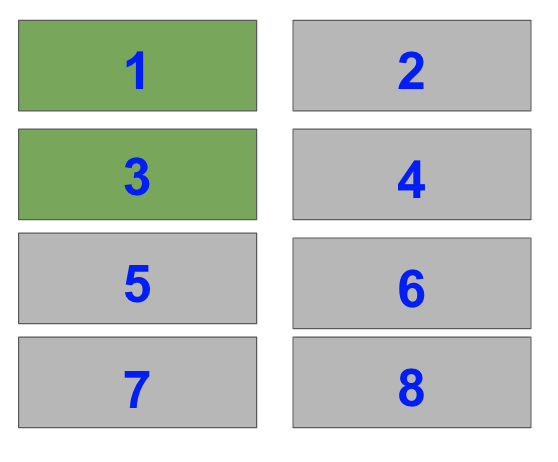
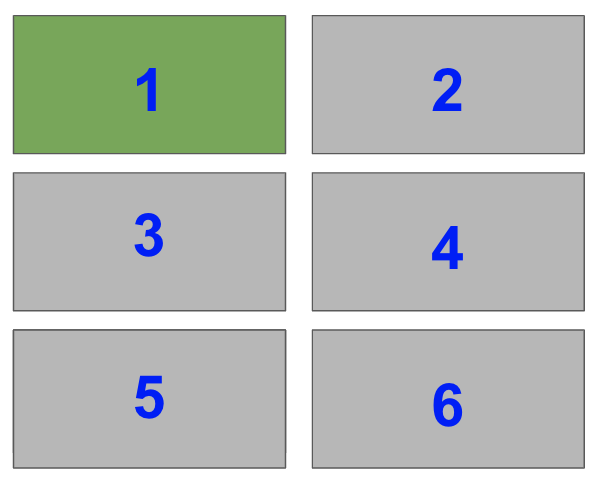
I’m going to create this shape.
I’ve labeled the fraction each Subplot takes up as we need this for our fig.add_subplot() calls.
I’ll create the biggest Subplot first and the others in descending order.
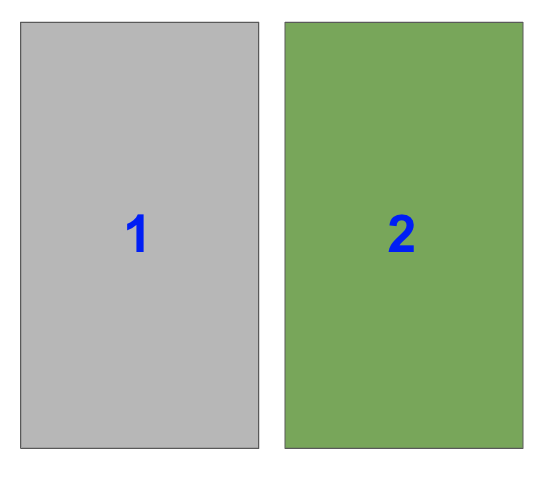
The right hand side is half of the plot. It is one of two plots on a Figure with 1 row and 2 columns. To select it with fig.add_subplot(), you need to set index=2.
Remember that indexing starts from 1 for the functions plt.subplot() and fig.add_subplot().
In the image, the blue numbers are the index values each Subplot has.
ax1 = fig.add_subplot(122)
As you are working with Axes objects, you need to store the result of fig.add_subplot() so that you can plot on it afterwards.
Now, select the bottom left Subplot in a a 2×2 grid i.e. index=3
ax2 = fig.add_subplot(223)
Lastly, select the top two Subplots on the left hand side of a 4×2 grid i.e. index=1 and index=3.
# Initialise Figure
fig = plt.figure() # Add 4 Axes objects of the size we want
ax1 = fig.add_subplot(122)
ax2 = fig.add_subplot(223)
ax3 = fig.add_subplot(423)

ax4 = fig.add_subplot(421) plt.tight_layout(pad=0.1)
plt.show()
Perfect! Breaking the Subplots down into their individual parts and knowing the shape you want, makes everything easier.
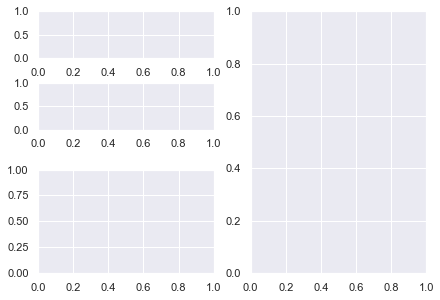
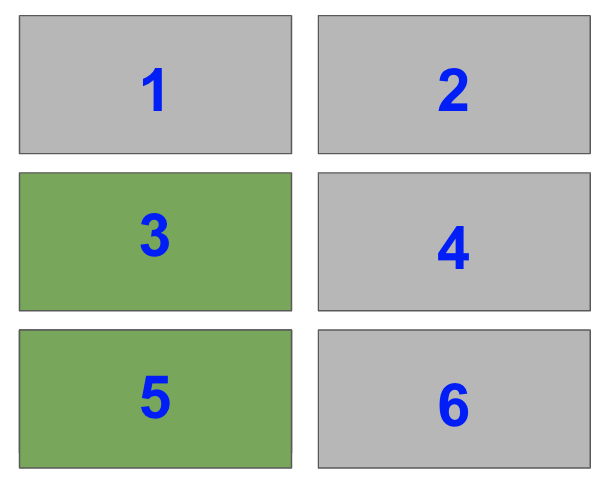
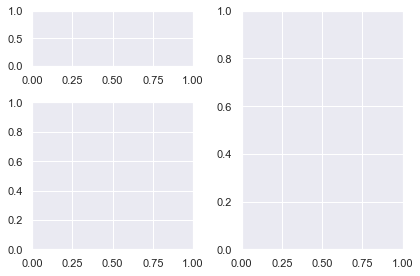
Now, let’s do something you can’t do with plt.subplot(). Let’s have 2 plots on the left hand side with the bottom plot twice the height as the top plot.
Like with the above plot, the right hand side is half of a plot with 1 row and 2 columns. It is index=2.
So, the first two lines are the same as the previous plot
fig = plt.figure()

ax1 = fig.add_subplot(122)
The top left takes up 1/3 of the space of the left-hand half of the plot. Thus, it takes up 1/3 x 1/2 = 1/6 of the total plot. So, it is index=1 of a 3×2 grid.
ax2 = fig.add_subplot(321)
The final subplot takes up 2/3 of the remaining space i.e. index=3 and index=5 of a 3×2 grid. But you can’t add both of these indexes as that would add two Subplots to the Figure. You need a way to add one Subplot that spans two rows.
You need the matplotlib subplot2grid function – plt.subplot2grid(). It returns an Axes object and adds it to the current Figure.
shape – tuple of 2 integers – the shape of the overall grid e.g. (3, 2) has 3 rows and 2 columns.
loc – tuple of 2 integers – the location to place the Subplot in the grid. It uses 0-based indexing so (0, 0) is first row, first column and (1, 2) is second row, third column.
rowspan – integer, default 1- number of rows for the Subplot to span to the right
colspan – integer, default 1 – number of columns for the Subplot to span down
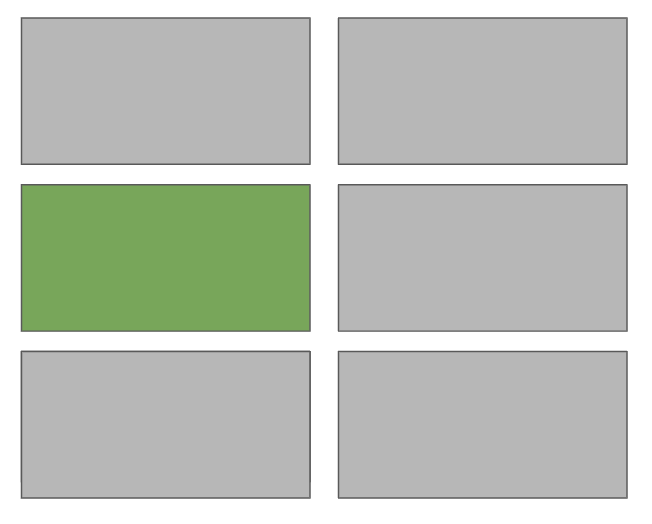
From those definitions, you need to select the middle left Subplot and set rowspan=2 so that it spans down 2 rows.
Thus, the arguments you need for subplot2grid are:
shape=(3, 2) – 3×2 grid
loc=(1, 0) – second row, first colunn (0-based indexing)
Sidenote: why matplotlib chose 0-based indexing for loc when everything else uses 1-based indexing is a mystery to me. One way to remember it is that loc is similar to locating. This is like slicing Numpy arrays which use 0-indexing. Also, if you use GridSpec, you will often use Numpy slicing to choose the number of rows and columns that Axes span.
If you aren’t happy with the spacing between plots that plt.tight_layout() provides, manually adjust the spacing with the matplotlib subplots_adjust function.
It takes 6 optional, self explanatory arguments. Each is a float in the range [0.0, 1.0] and is a fraction of the font size:
left, right, bottom and top is the spacing on each side of the Suplots
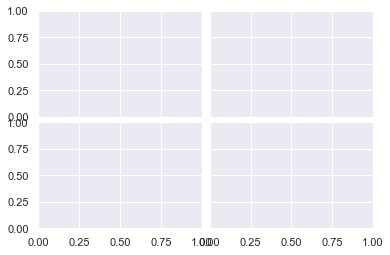
Now I’ve decreased the height and width between Subplots to 0.05 and there is hardly any space between them.
To avoid loads of similar examples, I recommend you play around with the arguments to get a feel for how this function works.
Matplotlib Subplots Colorbar
Adding a colorbar to each Axes is similar to adding a legend. You store the ax.plot() call in a variable and pass it to fig.colorbar().
Colorbars are Figure methods since they are placed on the Figure itself and not the Axes. Yet, they do take up space from the Axes they are placed on.
Let’s look at an example.
# Generate two 10x10 arrays of random numbers in the range [0.0, 1.0]

data1 = np.random.random((10, 10))

data2 = np.random.random((10, 10)) # Initialise Figure and Axes objects with 1 row and 2 columns

# Constrained_layout=True is better than plt.tight_layout()

# Make twice as wide as it is long with figaspect

fig, axes = plt.subplots(nrows=1, ncols=2, constrained_layout=True, figsize=plt.figaspect(1/2)) pcm1 = axes[0].pcolormesh(data1, cmap='Blues')

# Place first colorbar on first column - index 0

fig.colorbar(pcm1, ax=axes[0]) pcm2 = axes[1].pcolormesh(data2, cmap='Greens')

# Place second colorbar on second column - index 1

fig.colorbar(pcm2, ax=axes[1]) plt.show()
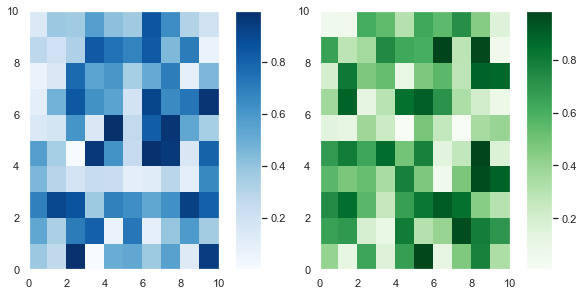
First, I generated two 10×10 arrays of random numbers in the range [0.0, 1.0] using the np.random.random() function. Then I initialized the 1×2 grid with plt.subplots().
The keyword argument constrained_layout=True achieves a similar result to calling plt.tight_layout(). However, tight_layout only checks for tick labels, axis labels and titles. Thus, it ignores colorbars and legends and often produces bad looking plots. Fortunately, constrained_layout takes colorbars and legends into account. Thus, it should be your go-to when automatically adjusting these types of plots.
Finally, I set figsize=plt.figaspect(1/2) to ensure the plots aren’t too squashed together.
After that, I plotted the first heatmap, colored it blue and saved it in the variable pcm1. I passed that to fig.colorbar() and placed it on the first column – axes[0] with the ax keyword argument. It’s a similar story for the second heatmap.
The more Axes you have, the fancier you can be with placing colorbars in matplotlib. Now, let’s look at a 2×2 example with 4 Subplots but only 2 colorbars.
# Set seed to reproduce results

np.random.seed(1) # Generate 4 samples of the same data set using a list comprehension # and assignment unpacking

data1, data2, data3, data4 = [np.random.random((10, 10)) for _ in range(4)] # 2x2 grid with constrained layout

fig, axes = plt.subplots(nrows=2, ncols=2, constrained_layout=True) # First column heatmaps with same colormap

pcm1 = axes[0, 0].pcolormesh(data1, cmap='Blues')

pcm2 = axes[1, 0].pcolormesh(data2, cmap='Blues') # First column colorbar - slicing selects all rows, first column

fig.colorbar(pcm1, ax=axes[:, 0]) # Second column heatmaps with same colormap

pcm3 = axes[0, 1].pcolormesh(data3+1, cmap='Greens')

pcm4 = axes[1, 1].pcolormesh(data4+1, cmap='Greens') # Second column colorbar - slicing selects all rows, second column

# Half the size of the first colorbar

fig.colorbar(pcm3, ax=axes[:, 1], shrink=0.5) plt.show()
If you pass a list of Axes to ax, matplotlib places the colorbar along those Axes. Moreover, you can specify where the colorbar is with the location keyword argument. It accepts the strings 'bottom', 'left', 'right', 'top' or 'center'.
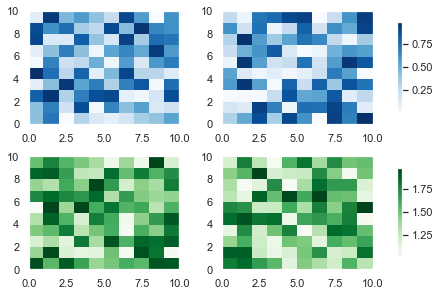
The code is similar to the 1×2 plot I made above. First, I set the seed to 1 so that you can reproduce the results – you will soon plot this again with the colorbars in different places.
I used a list comprehension to generate 4 samples of the same dataset. Then I created a 2×2 grid with plt.subplots() and set constrained_layout=True to ensure nothing overlaps.
Then I made the plots for the first column – axes[0, 0] and axes[1, 0] – and saved their output. I passed one of them to fig.colorbar(). It doesn’t matter which one of pcm1 or pcm2 I pass since they are just different samples of the same dataset. I set ax=axes[:, 0] using Numpy slicing notation, that is all rows : and the first column 0.
It’s a similar process for the second column but I added 1 to data3 and data4 to give a range of numbers in [1.0, 2.0] instead. Lastly, I set shrink=0.5 to make the colorbar half its default size.
Now, let’s plot the same data with the same colors on each row rather than on each column.
# Same as above

np.random.seed(1)

data1, data2, data3, data4 = [np.random.random((10, 10)) for _ in range(4)]

fig, axes = plt.subplots(nrows=2, ncols=2, constrained_layout=True) # First row heatmaps with same colormap

pcm1 = axes[0, 0].pcolormesh(data1, cmap='Blues')

pcm2 = axes[0, 1].pcolormesh(data2, cmap='Blues') # First row colorbar - placed on first row, all columns

fig.colorbar(pcm1, ax=axes[0, :], shrink=0.8) # Second row heatmaps with same colormap

pcm3 = axes[1, 0].pcolormesh(data3+1, cmap='Greens')

pcm4 = axes[1, 1].pcolormesh(data4+1, cmap='Greens') # Second row colorbar - placed on second row, all columns

fig.colorbar(pcm3, ax=axes[1, :], shrink=0.8) plt.show()
This code is similar to the one above but the plots of the same color are on the same row rather than the same column. I also shrank the colorbars to 80% of their default size by setting shrink=0.8.
Finally, let’s set the blue colorbar to be on the bottom of the heatmaps.
You can change the location of the colorbars with the location keyword argument in fig.colorbar(). The only difference between this plot and the one above is this line
If you increase the figsize argument, this plot will look much better – at the moment it’s quite cramped.
I recommend you play around with matplotlib colorbar placement. You have total control over how many colorbars you put on the Figure, their location and how many rows and columns they span. These are some basic ideas but check out the docs to see more examples of how you can place colorbars in matplotlib.
Matplotlib Subplot Grid
I’ve spoken about GridSpec a few times in this article. It is the underlying class that specifies the geometry of the grid that a subplot can be placed in.
You can create any shape you want using plt.subplots() and plt.subplot2grid(). But some of the more complex shapes are easier to create using GridSpec. If you want to become a total pro with matplotlib, check out the docs and look out for my article discussing it in future.
Summary
You can now create any shape you can imagine in matplotlib. Congratulations! This is a huge achievement. Don’t worry if you didn’t fully understand everything the first time around. I recommend you bookmark this article and revisit it from time to time.
You’ve learned the underlying classes in matplotlib: Figure, Axes, XAxis and YAxis and how to plot with respect to them. You can write shorter, more readable code by using these methods and ax.set() to add titles, xlabels and many other things to each Axes. You can create more professional looking plots by sharing the x-axis and y-axis and add legends anywhere you like.
You can create Figures of any size that include Subplots of any size – you’re no longer restricted to those that take up 1/xth of the plot. You know that to make the best plots, you should plan ahead and figure out the shape you are aiming for.
You know when to use plt.tight_layout() (ticks, labels and titles) and constrained_layout=True (legends and colorbars) and how to manually adjust spacing between plots with plt.subplots_adjust().
Finally, you can add colorbars to as many Axes as you want and place them wherever you’d like.
You’ve done everything now. All that is left is to practice these plots so that you can quickly create amazing plots whenever you want.
Where To Go From Here?
Do you wish you could be a programmer full-time but don’t know how to start?
Check out my pure value-packed webinar where I teach you to become a Python freelancer in 60 days or your money back!
It doesn’t matter if you’re a Python novice or Python pro. If you are not making six figures/year with Python right now, you will learn something from this webinar.
These are proven, no-BS methods that get you results fast.
This webinar won’t be online forever. Click the link below before the seats fill up and learn how to become a Python freelancer, guaranteed.
Today we are checking out Voxelator, a free browser based Voxel painting application from the creator of the Pixelator application we covered earlier. In the video below we go hands-on with Voxelator.
There are some licensing limitations to be aware of for using Voxelator:
Voxelator is a free software and you can choose which license to attach to the models you produce with it, and use them for any purpose — commercially included (provided you did not use any external resources with limiting licenses). With that said, you may not do the following with Voxelator:
You may not attempt to download its source and use it locally from your computer.
You may not attempt to upload Voxelator to a different domain or site.
You may not attempt to embed Voxelator in an external domain, using an iframe or any other technology.
You may not attempt to redistribute Voxelator in any way, not commercially and not for free.
You may not reuse Voxelator’s code for any purpose.
You can run Voxelator on any browser supporting WebGL 2 and ECMAScript 6 support, although Chrome is the primary supported browser. You can learn more about using Voxelator here.
By Christine McKee Saturday, February 08, 2020, 04:34 pm PT (07:34 pm ET)
Apple’s popular 16-inch MacBook Pro with a Core i9 processor and upgraded graphics is $300 off, but don’t delay as the special deal ends tonight.
Lowest price available
Both B&H and Amazon have issued a $300 markdown on Apple’s premium Core i9 16-inch MacBook Pro this Saturday. Along with the upgraded 2.3GHz processor, the high-end configuration is equipped with 16GB of memory, 1TB of storage and 5500M 4GB graphics. Now $2,499 after the $300 discount, this offer ends tonight at 11:59 p.m. Eastern time at B&H. Considering Amazon has matched B&H’s price, it’s likely the price will change at Amazon as well.
Those looking for the best deal on the standard model can also snap up $300 in savings at B&H on the base config in your choice of Silver or Space Gray finish. According to B&H, supplies are limited at the reduced price.
B&H is also including a number of perks, such as free 2-day shipping within the contiguous U.S. for speedy delivery to your door. Shoppers residing in eligible states can also get a sales tax refund with the Payboo Card, or customers can opt for no interest financing when paid in full within 12 months with the B&H Financing Card. The Payboo card is best geared for those who are willing to pay off the balance in full right away but want to pocket an extra $168 to $200 on average in addition to the $300 markdown on the systems themselves.
Add AppleCare An AppleCare extended protection plan can be added to these 16-inch MacBook Pro laptops during checkout. Simply look for the AppleCare option in your cart.
Additional Apple deals
AppleInsider and Apple authorized resellers are also running additional exclusive savings on Apple hardware that will not only deliver the lowest prices on many of the items, but also throw in bonus discounts on AppleCare, software and more. These offers are as follows:
The kernel team is working on final integration for kernel 5.5. This version was just recently released, and will arrive soon in Fedora. This version has many security fixes included. As a result, the Fedora kernel and QA teams have organized a test week from Monday, February 10, 2020 through Monday, February 17, 2020. Refer to the wiki page for links to the test images you’ll need to participate. Read below for details.
How does a test week work?
A test day/week is an event where anyone can help make sure changes in Fedora work well in an upcoming release. Fedora community members often participate, and the public is welcome at these events. If you’ve never contributed before, this is a perfect way to get started.
To contribute, you only need to be able to do the following things:
Download test materials, which include some large files
Read and follow directions step by step
The wiki page for the kernel test day has a lot of good information on what and how to test. After you’ve done some testing, you can log your results in the test day web application. If you’re available on or around the day of the event, please do some testing and report your results.
Happy testing, and we hope to see you in the Test Week.
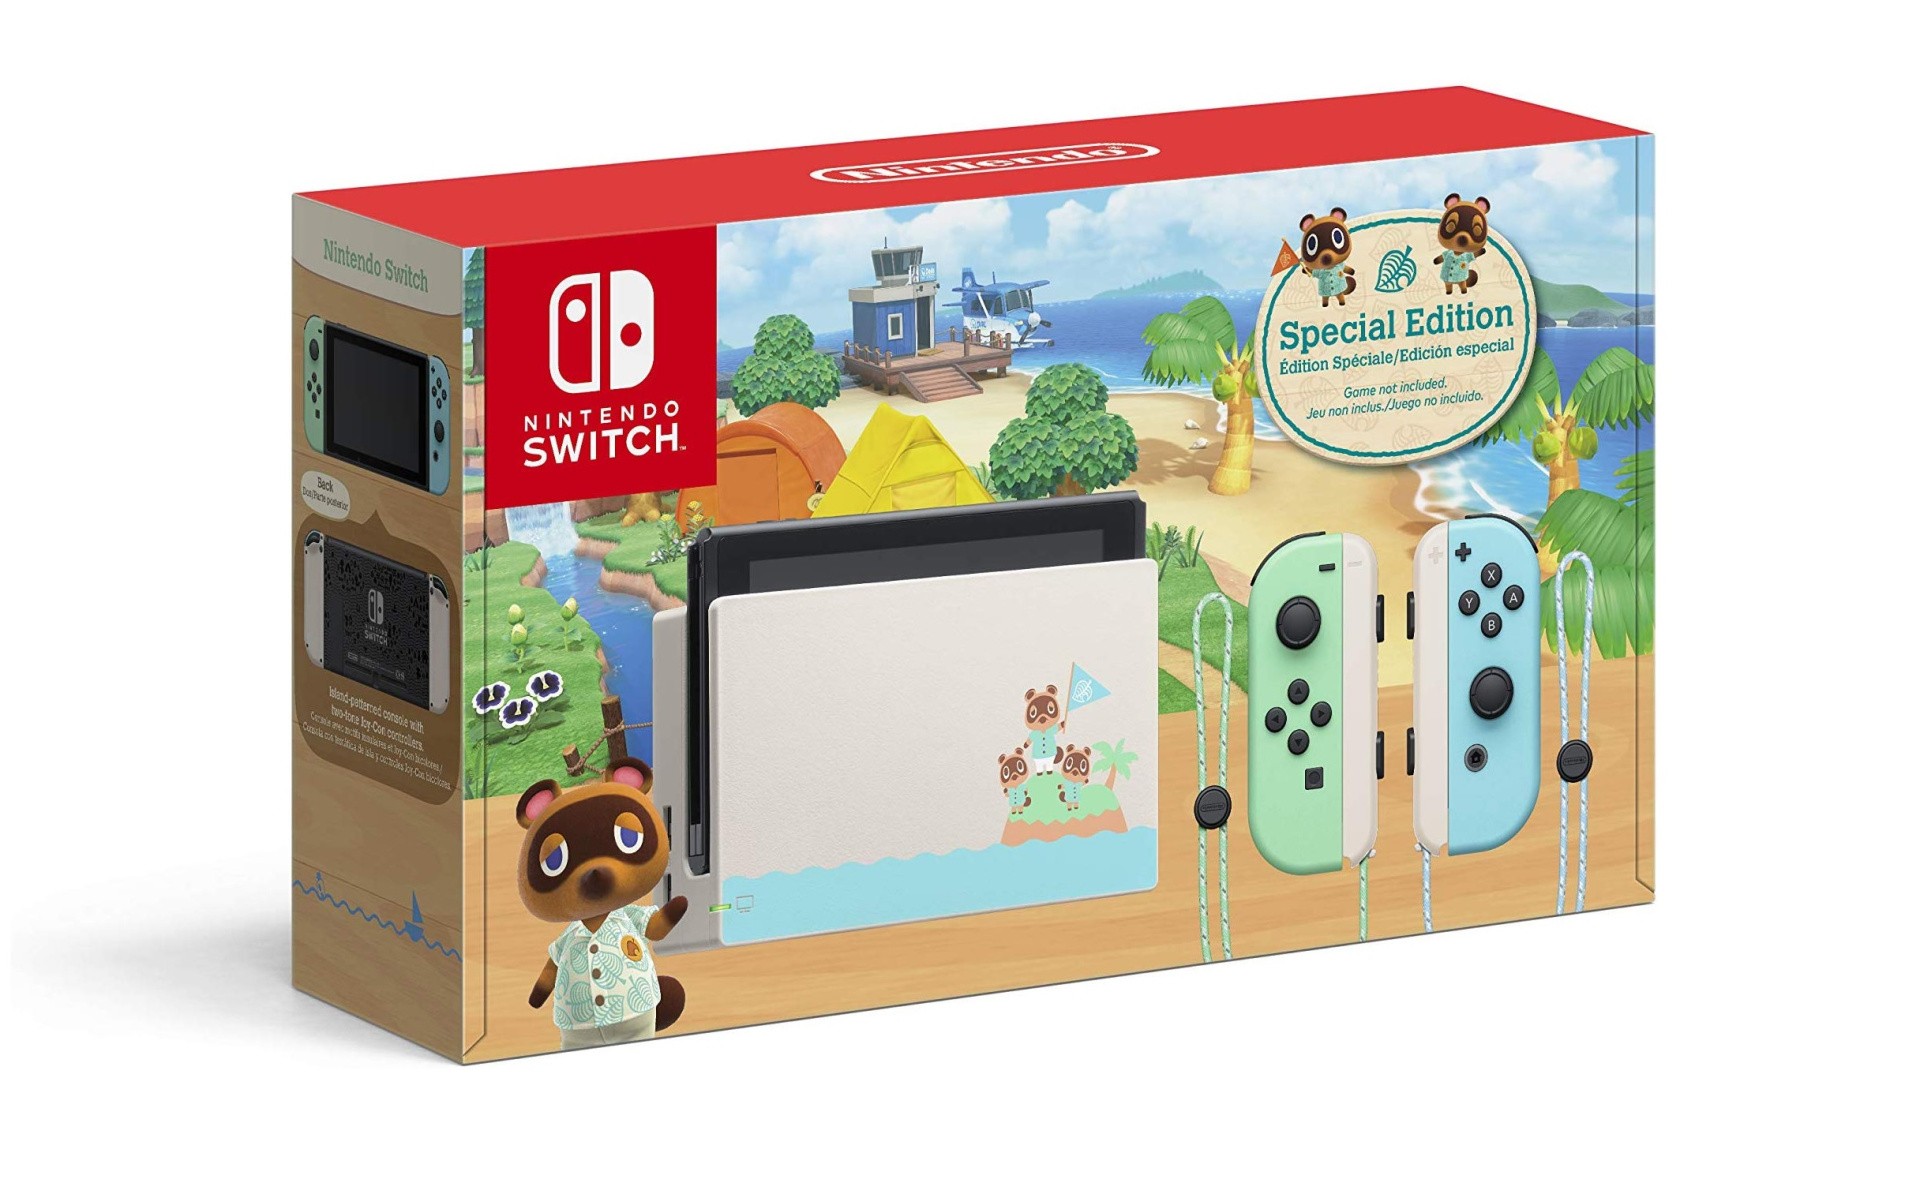
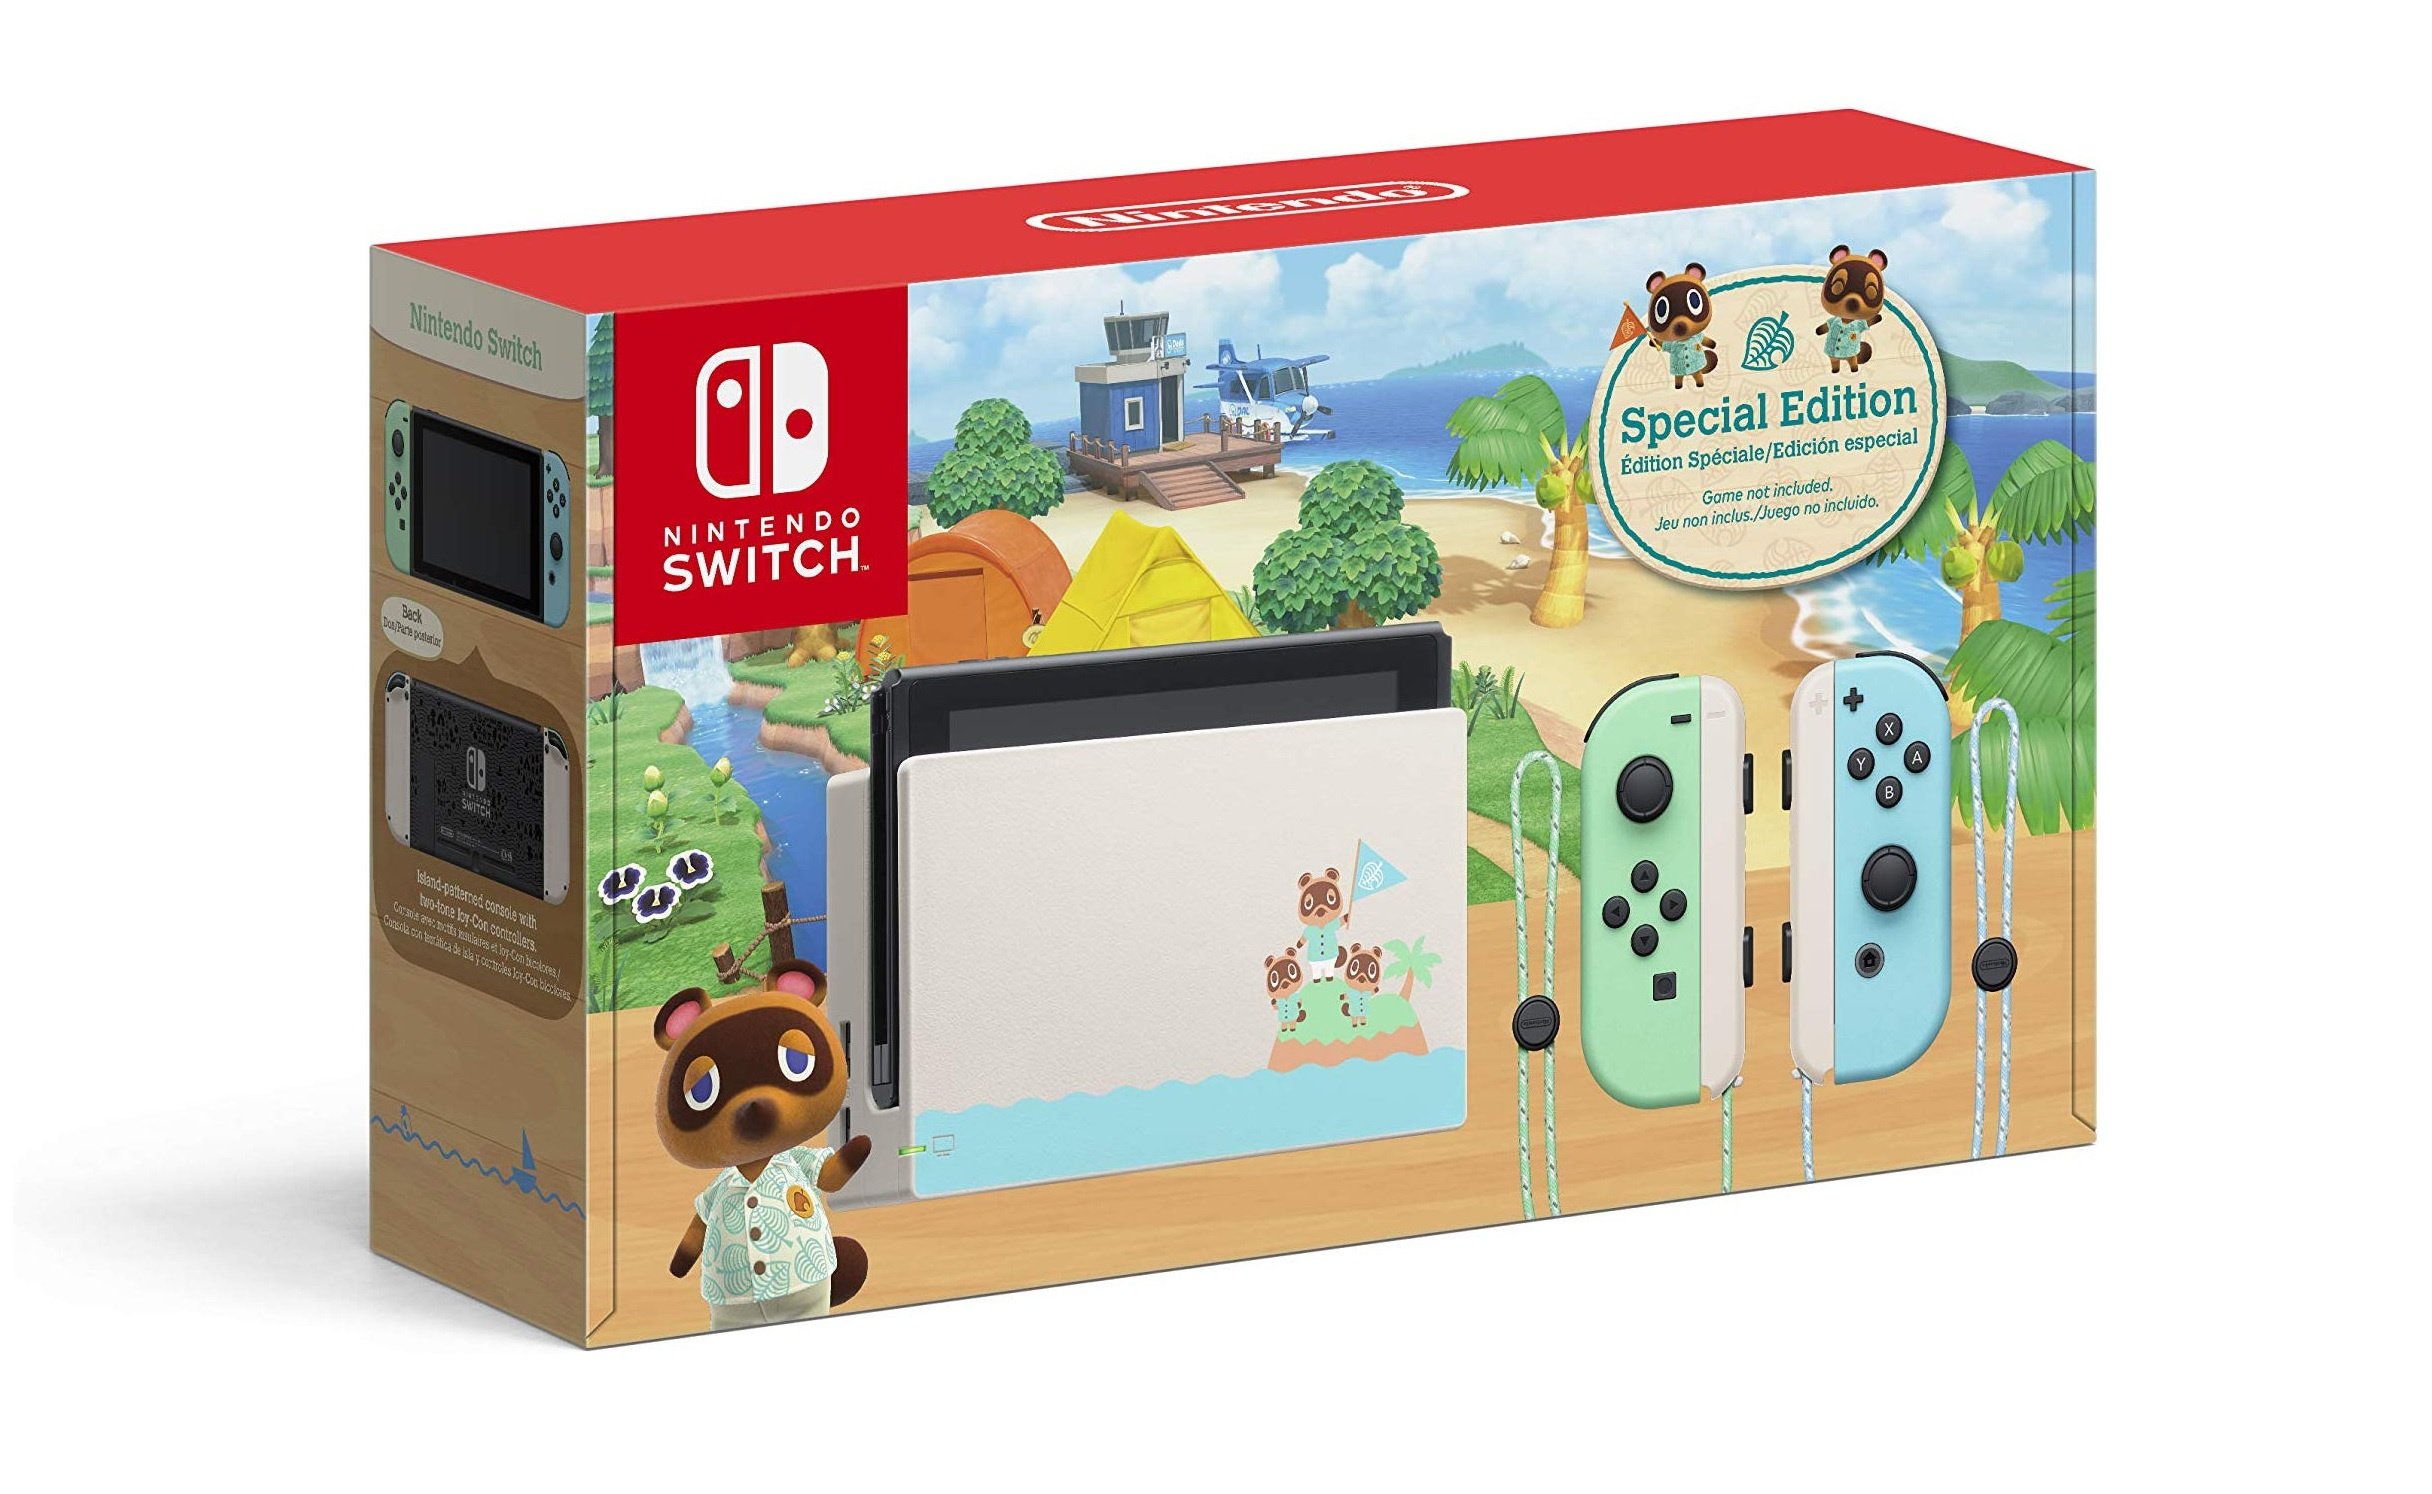
Video: Nintendo Minute Unboxes The Animal Crossing: New Horizons Switch
The NA version doesn’t include the game
Animal Crossing: New Horizons arrives on the Switch next month and to promote this upcoming release, Nintendo is going all out with plenty of merchandise and even a themed Nintendo Switch.
As you might have already heard, the UK version of this system will include a digital code for the game, but if you live in North America you’ll have to fork out for a copy. With this in mind, Nintendo Minute has uploaded an unboxing video of the US model. Take a look below:
If you really want this bundle but can’t justify buying a brand new Switch, there is one other way to get hold of the themed dock and Joy-Con. Provided you live in Japan, you’ll be able to purchase both of these items separately. You can even buy the box by itself, if you really want.
Did you pre-order this Switch? How about the game? Leave a comment below.



 RESIDENT EVIL 2 / BIOHAZARD RE:2 Deluxe Edition at -69%
 Devil May Cry 5 - Deluxe Edition at 66% OFF
 Casual Cruise Bundle with 9 Games at 93% OFF
 Raw Fury Lunar New Year Sale, up to -80%











 Sacred Mysteries Bundle
 Honeymoon on Mars Bundle
 Lunar Voyage Bundle
  Dharker Studio Bundle
  Mystery Rain Bundle
  Hentai Honeypot Bundle
 Shade & Hate Bundle
  Team17 Publisher Sale, up to -90%
 Handy Games Publisher Sale, up to -80%
 Bigben Interactive Publisher Sale, up to -90%
  Konami Lunar New Year Sale, EMEA ONLY, up to.-75%
 Dovetail Games Lunar New Year Sale, up to -80%
 Capcom Lunar New Year Sale, up to -80%