Posted by: xSicKxBot - 03-26-2020, 07:40 AM - Forum: Windows
- No Replies
Sea of Thieves turns 2: How many of the 38 additions have you tried?
A lot has changed in Sea of Thieves since Rare’s shared world pirate fantasy first set sail in March 2018. Thanks to a series of major content updates in the first year – including the game-changing Anniversary Update – and a recent commitment to regular monthly updates, the game has grown and evolved at a scale that few other service-based games can match. Even better, all content has been added for free!
To celebrate the game’s second anniversary, here are 38 of the biggest things that have been added over the past two years. If you’re yet to try the game or haven’t played for a while, be sure to jump in by trying it out with Xbox Game Pass or buying the game on the Microsoft Store or your local retailer. Sea of Thieves’ uniquely horizontal progression system means that you can set sail again at any time and not be at a disadvantage against other players.
1) Tall Tales Tall Tales are Sea of Thieves’ unique take on a story-driven campaign, offering cinematic quests within the game’s emergent shared world. The first collection of stories, Shores of Gold, take players on an epic adventure in search of a lost island and magical treasure, while recent additions ‘The Seabound Soul’ and ‘Heart of Fire’ tell a whole new story. Available to solo players or crews of any size, there are eleven Tall Tales in total which should keep you occupied for up to 30 hours.
2) The Arena Added as part of 2019’s mega Anniversary Update, The Arena is a standalone competitive game mode that lets crews battle it out in fixed-length contests described by Eurogamer as “glorious, consequence-free PvP carnage”. The Arena also features its own Trading Company – the Sea Dogs – with which you can earn reputation and rise in rank, together with its own social space and cosmetic rewards.
3) The Megalodon The game’s first Megalodon – think Jaws on steroids – was added to the game in its first major content update, The Hungering Deep. This fearsome giant shark was an emergent threat that could attack ships at any time, with rewards for crews who could defeat it. It was later followed to the Sea of Thieves by many dangerous Megalodon variants, including rare species like the legendary Shrouded Ghost.
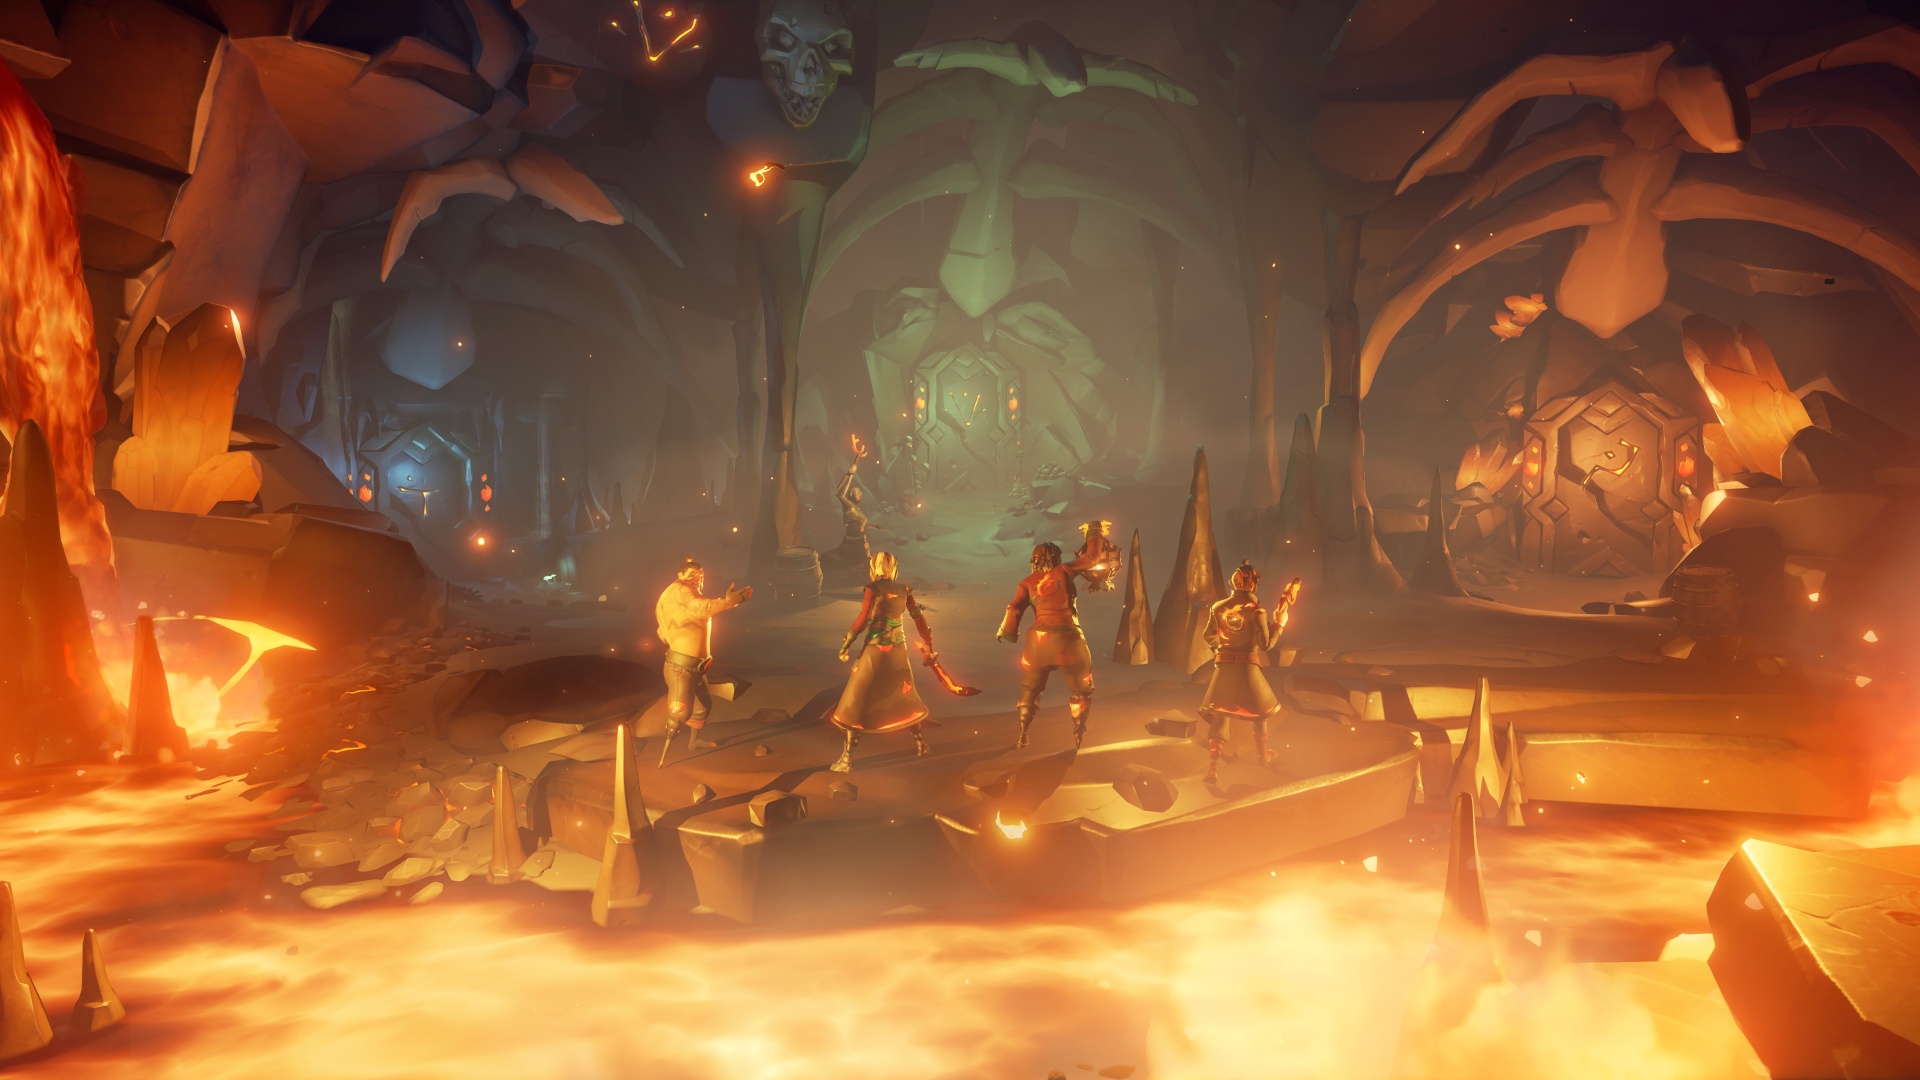
4) The Devil’s Roar The Devil’s Roar is a wild and dangerous world region that was added to the game with the Forsaken Shores content update (wonderfully brought to life by actor and comedian Matt Berry). This world region is full of natural perils including volcanoes, lava, geysers and superheated water. So dangerous is The Devil’s Roar that its Ashen treasures deliver sizeable gold and reputation gains when cashed in.
5) Skeleton Ships The introduction of Skeleton Ships in July 2018 changed the game by allowing players to engage in ship-to-ship combat outside of PvP. These fearsome sea-based threats can be found sailing beneath the ship-shaped cloud, and can burst from beneath the waves without warning to ambush unsuspecting pirates. Sink them and take their treasure!
6) Fog Providing the ‘Shrouded’ bit of November 2018’s Shrouded Spoils content update, fog brought both atmosphere and gameplay depth. Exploring islands in thick fog adds an additional layer of threat and complexity, while clever captains can use the swirling mists to hide their ships from other crews…
7) Maiden Voyage The Maiden Voyage is a tutorial that goes the extra mile. Set just outside Sea of Thieves’ shared world, the Maiden Voyage is the perfect opportunity for new pirates to find their sea legs in a safe space. And while it’s perfect for new players wanting to learn how to play, it also offers plenty for more experienced players including a chance to meet the Pirate Lord himself and earn some exclusive cosmetics.
8) Fire The addition of fire turned up the heat on players when it was added to the game last November. Fires can be started by firebombs, angry Chests of Rage or through less aggressive means, such as leaving food on the ship’s stove unattended. One thing’s for sure, fire had a huge impact on the game and proved that Alfred Pennyworth was right when he observed: “Some men just want to watch the world burn.”
9) Lots of lovely emergent loot Back at launch, finding treasure could be a difficult business. But these days the Sea of Thieves is positively awash with loot, with Barrels of Plenty (floating barrels of bonus treasure), emergent Skeleton Captains, increased shipwreck loot, Mermaid Statues and their valuable gems, treasure maps in barrels, more washed-up treasure and rewards for defeating the Megalodon, Kraken and Skeleton Ships.
10) Fishing People asked. And asked. And asked some more. So as part of the Anniversary Update, Rare added a huge fishing mechanic to the game that offers hours of distraction from epic adventuring. There are 10 main types of fish, each with their own variants, some of which can only be caught in specific world regions with the right bait and conditions. You can cook and eat fish to restore health, or cash them in with The Hunter’s Call Trading Company found at any Seapost. Sea of Thieves’ fishing was the highest-rated experience in PC Gamer’s article ‘Which PC game has the best fishing?’.
11) The Hunter’s Call Trading Company Headed by the lovable Merrick (of The Hungering Deep fame), The Hunter’s Call is a Trading Company that rewards players for catching and cooking fish or meat. Unique among Trading Companies in that its representatives are located at Seaposts rather than Outposts, The Hunter’s Call offers a more leisurely path to Pirate Legend status.
12) Cargo Runs Introduced to the game back in the Forsaken Shores update, Cargo Runs are a twist on the standard Merchant Alliance quest. Collect and deliver valuable cargo to various locations across the Sea of Thieves, both on time and in good condition, for a handsome payday.
13) Legends of the Sea Sea of Thieves’ world has always contained Easter eggs that celebrate the stories of our most legendary players. Umbra’s sidequests, introduced in January 2020’s Legends of the Sea update, offer players the chance to earn Commendations and Doubloons for tracking down the stories behind these inspiring and entertaining player immortalisations.
14) Fort of the Damned Raiding Skeleton Forts has always been an essential part of the Sea of Thieves experience, but the Fort of the Damned is a standout encounter. Released in time for Halloween 2019, this spooky Fort represents a major upgrade on the raid experience, both in terms of challenge and reward. Unlike other Forts, the Fort of the Damned can be activated on demand by crews who want to unlock its treasures again and again.
15) Gunpowder Skeletons First came skeletons. Then skeletons with weapons (including snipers and cannoneers). But things got serious once the skeletons of the Sea of Thieves discovered that Gunpowder Barrels also make very effective weapons. Boom!
16) Stronghold Kegs Available through raiding Forts, Stronghold Kegs are Gunpowder Barrels that make a really big bang (colloquially known as “mega-kegs”). These rare items command a high price from the Merchant Alliance, or they can be used as devastating weapons against all manner of enemies…
17) Reaper’s Chests Reaper’s Chests are high-value chests found emergently in shipwrecks across the Sea of Thieves, and reveal their location through a mysterious beacon that rises up to the sky. But beware – once a Reaper’s Chest is recovered, other crews will be able to see on the map that you have this valuable reward and can hunt you down.
18) Pets Every pirate needs an animal companion. The Pirate Emporium, added to the game in September 2019, brought with it a range of lovable pet parrots and monkeys, with more types still to come. Available in various breeds and colours, pets can also be dressed up in costumes for added hilarity. These furry and feathered sidekicks are an essential addition to any crew.
19) More than 100 new emotes Emotes have always been a popular way for players to express themselves, but the addition of the Pirate Emporium has seen more than 100 new emotes added to the game. From the classic “we’re flying” emote inspired by a certain sea-based movie to the infamous “Crab Dab”, there’s something for every pirate and every situation.
20) Cursed Cannonballs Introduced to the game as part of July 2018’s Cursed Sails update, Cursed Cannonballs are powerful weapons that can be found emergently in the world. Each of the eleven types of Cursed Cannonballs imparts a powerful, time-limited effect on an enemy, from making them dance to rendering their cannons impotent.
21) Cooking Not only did the Anniversary Update bring fishing and hunting to the game, it brought cooking to legions of hungry pirates. Food can be cooked using the stove aboard every ship or at campfires. Once perfectly prepared, cooked food can be eaten to restore health or sold to The Hunter’s Call for a premium.
22) The Bilge Rats The Bilge Rats are an unofficial Trading Company who arrived in Sea of Thieves in summer 2018. Dedicated to celebrating a pirate’s life of adventure outside the traditional Trading Companies, Duke and his motley crew give players a range of regular sidequests which can unlock additional rewards and cosmetics.
23) Alliances Sometimes it can be Sea of Friends, thanks to the Alliance feature that lets two or more crews team up to improve the odds and share the rewards. Perfect for pirates looking to earn loot in a hurry, and a great way to meet other players and make friends.
24) Creator Crew With its emphasis on player freedom and creativity, Sea of Thieves is a hugely watchable game. The Creator Crew is a programme which helps budding streamers and YouTubers get noticed, offering asset packs, opportunities to have work shared across official channels and ‘How To’ tutorials for improving content. What’s more, there’s also the chance to unlock exclusive cosmetic items by completing creator challenges. Go create and share your pirate stories!
25) Brigantines Another feature that was introduced in the Cursed Sails update, the Brigantine is a ship type made for three players. More agile than a Galleon but boasting significantly more firepower than a Sloop, Brigantines soon became a player favourite.
26) Rowboats Originally introduced in the Forsaken Shores update as a tool to deal with the superheated waters of the volcanic Devil’s Roar region, Rowboats are perfect for pirates looking to move around more loot than they can carry or sneak up on larger ships undetected. Racing them can also be fun!
27) The Harpoon Every ship – and even some Rowboats – now come equipped with harpoon guns. These handy tools can be used in lots of ways, from plucking resources out of the water to making a sharp turn around an island. They can also be used to steal treasure from unsuspecting pirates in what has become known within the community as a ‘zoink’.
28) Doubloons and the Black Market The arrival of the Bilge Rats on the Sea of Thieves also introduced a brand new currency which could be earned for completing time-limited events, a range of sidequests or by unlocking certain Commendations. Once earned, valuable Doubloons can be exchanged for rare cosmetics through the Black Market, or used to buy favour with the main Trading Companies and level up faster.
29) Seaposts Dotted around the Sea of Thieves, Seaposts are mini-Outposts. They offer crews a great opportunity to stock up on resources, plus you’ll find traders who’ll sell a variety of cosmetics at a discount. Seaposts are also home to The Hunter’s Call, so they’re where you need to go to sell fish and meat.
30) Chest of Rage Added recently in February 2020, the Chest of Rage is the latest Cursed Chest to be found within the game. These rare and valuable chests are filled with fury which vents itself regularly if not kept cool, making this a high-risk (but high-return) item which can also double up as a powerful weapon…
31) Collector’s Chests Originally introduced as part of Tall Tales: Shores of Gold, Collector’s Chests – chests that can be opened and will hold whatever treasure you put in – have recently been added as rewards for solving riddle quests. What does that mean? More loot!
32). Tucking Tucking, you say? What on earth is that? Let us explain. Pioneered by several high-profile streamers, ‘tucking’ in Sea of Thieves involves using emotes such as sleeping and sitting to hide aboard other players’ ships (the emote hides the gamertag above a player). Opening up a stealthy – not to mention hilarious – new way to play the game, tucking was officially recognised by the addition of a number of hide emotes to the Pirate Emporium (one of which is available to players for free).
33) Expanded ship customization Having a cool-looking ship is one of the best parts of Sea of Thieves. Every pirate takes pride in how their vessel looks, plus a ship’s visibility from distance means that it’s your calling card in the world. Since the Shrouded Spoils expansion, players can now determine all elements of how their ship looks including the sails, figurehead, hull, capstan, cannons, wheel and flag. Get customising!
34) Skeleton variety While the principal threat on land for pirates remains skeletal in nature, the threat has expanded through the addition of a number of skeleton variants – such as Gold, Plant, Shadow and Ashen – that each pose a different challenge. What’s more, you’ll also run into Skeleton Captains (and their crews) around the world, and may even encounter a fearsome Skeleton Lord…
35) Speaking Trumpet The Speaking Trumpet is a handy tool for anyone looking to communicate with another crew. Kind of like a pirate-themed megaphone, the Speaking Trumpet amplifies the distance over which voice and text chat can be heard by other crews. Perfect for communicating with other ships without getting too close (just in case).
36) Throwable weapons Throwable weapons offer more combat variety and come in two main flavours. Firebombs, as the name suggests, explode on impact and set fire to anything and anyone in the vicinity. Blunderbombs are closer in style to a grenade, dealing damage to (and knocking back) anyone in their blast radius.
37) Chainshot Another new game feature added just this March, chainshot is a new ammo type that can be loaded into cannons and used to take down another ship’s mast. Bringing more tactical depth to ship-to-ship combat, there’s nothing more satisfying than felling another ship’s mast in a single shot.
38) Another 1200 gamerscore Last but not least, the ever-expanding quantity of content in Sea of Thieves has also meant the addition of hundreds of new achievements and another 1200 gamerscore to play for (making a total of 2200 in all).
And there’s more! We haven’t even mentioned combat improvements, new musical instruments and more shanties to enjoy, hundreds of extra cosmetic items, a wealth of new Commendations or the countless ongoing quality of life improvements across all areas of the game. Visit the official Sea of Thieves website to see more about the latest updates, and for the latest on all things Xbox stay tuned to Xbox Wire.
The Xenoblade Chronicles Developer Monolith Soft Now Has 243 Employees
Monolith Soft has grown in strength and size ever since it was acquired by Nintendo in 2007. In recent years, it helped with the landscape design in The Legend of Zelda: Breath of the Wild and its definitive edition of the original Xenoblade Chronicles is expected to be released on the Switch at some point this year. It’s also assisting with the sequel to Breath of the Wild and working on a new RPG.
As a result of all these projects, it’s been on a non-stop recruitment drive for a number of years now. It ramped up its studio size to 120 employees in 2014 and last year was busy hiring staff for Breath of the Wild 2. Now, Silconera reports Monolith Soft has grown to 243 employees – that’s its highest employee count to date.
If all this has you wondering where Xenoblade Chronicles: Definitive Edition is, in the past few weeks it’s been listed for a May 29th launch by multiple online retailers. In saying this, Nintendo has made no official announcement about when the game will be released just yet, so there’s no certainty it will be launched in this particular month.
Posted by: xSicKxBot - 03-26-2020, 07:40 AM - Forum: Lounge
- No Replies
Half-Life: Alyx's 1.1 Update Adds New Movement Option
Two days after release, Valve has updated its VR hit Half-Life: Alyx with enhanced movement options. You can now use an analog stick to turn your perspective smoothly, as in most first-person games, a feature the game calls a Continuous Turn. As before the patch, you have the option of using the analog stick to turn in the direction you were already facing by a fixed number of degrees, which the game now calls a Snap Turn. Previously, it was known as a Quick Turn.
In this new setup, you can choose either to keep the Snap Turn or to change it to a Continuous Turn. If you choose the latter option, you can adjust the speed of the turn. You can also fiddle with the distance of the Snap Turn, or choose to turn off controller turning entirely. The patch added some minor improvements, including its detection of quality settings on some PCs. For more on the game's motion settings, check out our guide to Half-Life: Alyx's accessibility options.
In our review, our critic Michael Higham called Half-Life: Alyx a triumph. "Yes, this game is somewhat of a companion piece to mainline Half-Life games, taking place five years before Half-Life 2, but that doesn't really matter in the grand scheme of things. Disappointment you may have felt in its 13-year hiatus will feel like water under the bridge, and in a way, have played into just how powerful Half-Life: Alyx turned out to be. The names, the faces, the iconic objects that have become synonymous with Half-Life have their specific place. And if you weren't aware previously, you'll see just how important Alyx Vance--the series' most infallible personality--has been the entire time."
Posted by: xSicKxBot - 03-25-2020, 10:54 PM - Forum: Windows
- No Replies
Learning from our customers in the Greater China Region
As so many organizations have shifted to remote work during COVID-19, we are hearing inspiring stories from customers discovering new ways to connect, collaborate, and keep business moving. From Sydney, Australia, to Seattle, Washington, schools, hospitals, small businesses, and large companies alike have found inventive ways to enable remote work across their organizations. We want to share what they are learning. Each week we will be spotlighting customers in one impacted region around the globe. First up: the Greater China Region. My colleague Lily Zheng in Shanghai is sharing stories for customers who, faced with extraordinary and difficult circumstances, have found innovative new ways to work.
Since we last heard from Lily and team, the region has begun to move into recovery mode. “Many businesses reopened, and more and more people have started going back to work,” Lily reports. “In the past two months, Teams has certainly played an important role in helping our customers pass through the most difficult time.” Looking ahead, she says: “Teams can play an even bigger role in helping our customers boost their productivity and increase their business resilience.” Here are some examples of how organizations in the Greater China Region kept things moving over the past few months.
Education
With travel bans and health concerns keeping students, faculty, and staff at home over the past months, schools and universities have experienced a crash course in moving to remote learning. In February, the Peking University Guanghua School of Management used Teams to hold a digital school-opening ceremony with thousands of students. Meanwhile, Tamkang University, a private university headquartered in New Taipei City, Taiwan, quickly enabled distance learning for students in China, Macau, and Hong Kong by leveraging Microsoft Teams and cloud resources on their iClass Mobile Learning Platform. A total of 637 students and 1,041 teachers were set up to use the platform in 2,366 classes. Hong Kong Polytechnic University is conducting 120 to 160 concurrent teaching sessions daily through Microsoft Teams, with 10,000 to 11,000 students connecting simultaneously during peak times. And Wellington College International Tianjin, quickly established a solid e-learning program where students have been able to continue their learning journey with lessons conducted over Microsoft Teams.
Healthcare
The healthcare industry has faced extraordinary pressure during COVID-19. We’ve all seen news stories about medical supply challenges, but these organizations have experienced challenges in the IT space, too, including a lack of video conferencing solutions and heavy dependency on manual patient data inputting. Staff at the largest hospital in WenZhou, China, 2nd AffiliatedHospital of WMU, for instance, were unable to communicate with personnel inside the quarantined area. They had never used Teams before, but quickly deployed it and were able to communicate with quarantined-area colleagues. The team at Zhongshan Hospital in Shanghai hadn’t used Teams before the outbreak either, but they put it to use to hold their first remote leadership meeting. “It only took a few days to get reports,” said Mr. Li, Chief of Information Management Center at Zhongshan Hospital, “and we were able to successfully hold our first leader’s meeting, which was well-received by the whole leadership team.”
Commercial
SF-Express is one of the best-known logistics companies in China. CIO Sheng Wang said, “Fortunately, we deployed Teams after we revamped our network branches [in] December of 2019. “It solves our needs for remote working, meeting, and training, and allows our staff to collaborate with high productivity.” DHL Supply Chain China also deployed Teams to handle its increasing remote collaboration needs.
The manufacturing industry has been hit hard by the impact of the outbreak, but also used it to discover new ways to digitally transform. Headquartered in Ningbo, China, Joyson Electronic has more than 100 bases in 30 countries and over 50,000 employees globally. “Microsoft Teams really helps Joyson improve our cross-regional and boundary collaboration productivity during the COVID-19 outbreak,” reported CIO Zong Jia. “We hold daily internal meetings, co-edit documents, and interview candidates on Teams.”
Over 50 percent of China International Marine Containers (CIMC) Group Ltd.’s business comes from export, which brings an urgent need for project-based management and real-time communications. CIMC has been using Teams to easily enable multiple collaborative team channels and remove restrictions imposed by different work locations. They’re finding it facilitates employee collaboration and has helped them complete their first successful step towards a modern workplace transformation.
We hope you’ve found it helpful to read about some of the innovative ways our customers have transformed their organizations during this difficult time. We have seen how schools have moved quickly to remote learning in virtual classrooms, and are continuing to hold important meetings, with Teams. We’ve seen how healthcare workers, faced with communication barriers brought on by COVID-19, have used Teams to connect. And we’ve seen how commercial enterprises are bringing distributed teams together and are bringing formerly in-person-only meetings—including job interviews—online. As the Greater China Region enters a new phase of its COVID-19 experience, we look forward to learning about how they apply what they’ve discovered in the days to come. We’ll be sharing more inspiring customer stories here soon, so check back often.
Sony Intends To Remove More Nintendo Projects From Its PS4 Exclusive Dreams
Last weekend, news surfaced on social media that Sony had begun to take action against certain uploads and projects in Media Mocule’s latest title, Dreams. In particular, Nintendo-themed ones.
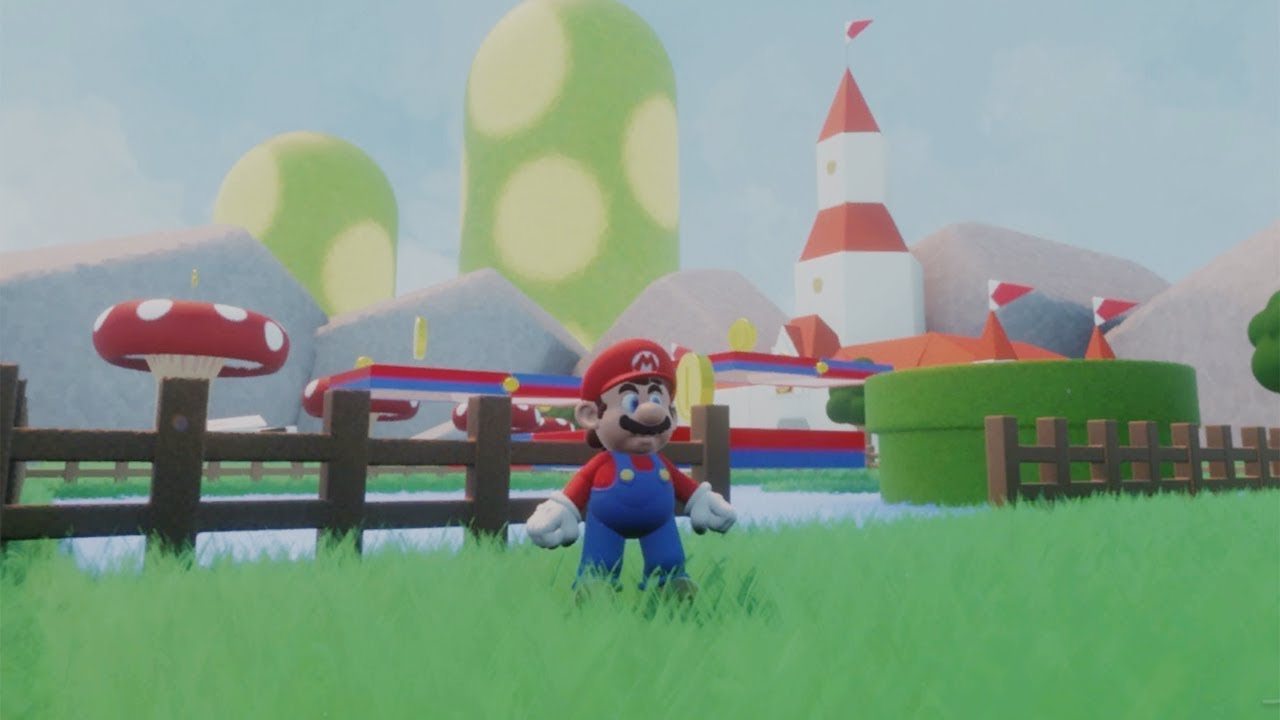
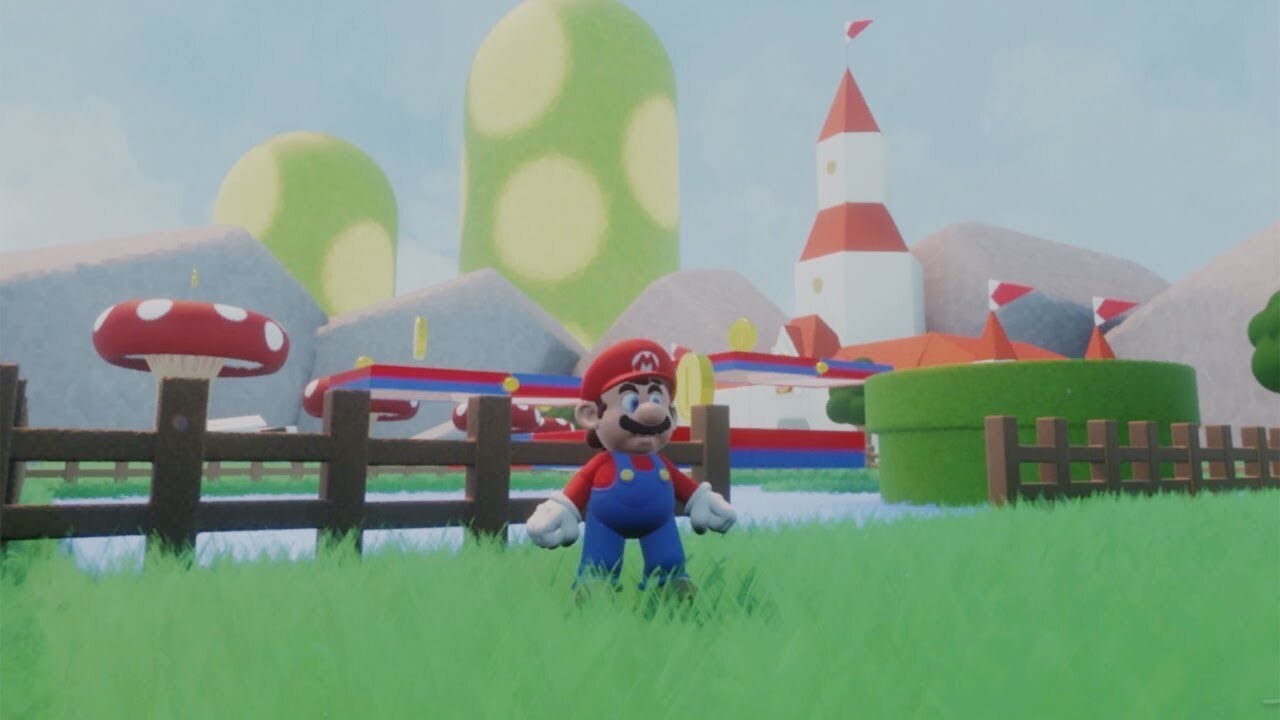
A user named @Piece_of_Craft shed some light via Twitter, explaining how they had supposedly been contacted by the legal and business affairs division of SIE Europe, as Nintendo had reportedly “objected” to the use of the Super Mario IP in the game.
Now, according to an update on GamesIndustry.biz (thanks, GoNintendo), it’s been confirmed Sony is working to take down even more Nintendo-themed creations. Here’s its exact statement:
Sony Interactive Entertainment is notifying the affected users that an IP Infringement Notice has been received from Nintendo and that the content will be removed. We cannot comment on volume of content to be removed, this is done on an individual case by case basis.
Seemingly it’s the end of the road for all of those Super Mario recreations in Dreams. Even if creators attempt to upload them, from now on projects will be moderated and removed for containing copyrighted material.
It was fun while it lasted, but anyone wanting to play a 3D Mario title with cutting edge graphics is perhaps better off sticking with Super Mario Odyssey on the Switch.
Do you want to plot numerical data? And do it in a beautiful, engaging, and scientifically sound way? And do all of this in a few simple lines of code? You’re in the right place!
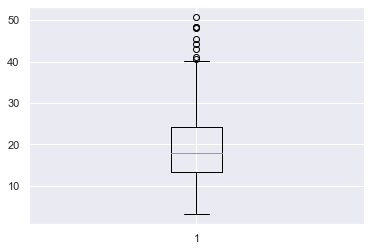
A great way to plot numerical data is the matplotlib boxplot. It displays the median, the interquartile range, and outliers of the data.
How can you visualize your data with the boxplot?
Get that data into an array-like object – list, NumPy array, pandas series, etc.
Pass it to plt.boxplot().
Call plt.show().
As a result, matplotlib will draw a lovely boxplot for you.
import matplotlib.pyplot as plt plt.boxplot(data)

plt.show()
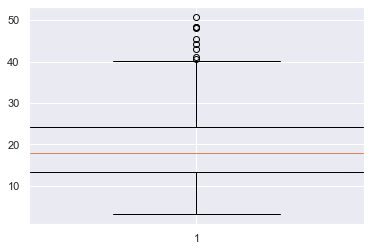
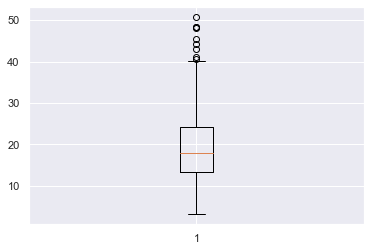
The boxplot clearly shows the median of the data (orange line), the upper and lower quartiles (top and bottom parts of the box) and outliers (the circles at the top and/or bottom of the ‘whiskers’ of the plot).
There are quite a few things we can do to improve this plot – we don’t even know what the data represents! – so let’s dive into a more detailed example.
Try It Yourself:
You can play with a simple example here in our interactive Python shell online. The resulting plot will be stored in a .png file in the online project (just click on “files”):
Matplotlib Boxplot Example
The boxplot is an essential tool you should use when when exploring datasets. The matplotlib boxplot function accepts a lot of keyword arguments and so can seem quite intimidating if you look at the docs. So, I’ll cover the most essential ones that you will use most often.
Boxplots show the distribution of numerical data, in particular they show if it is skewed and whether there are unusual observations/outliers. They are very helpful if you are dealing with a large amount of data and want to see a visual summary – in this way, they are similar to histograms. They give you ability to compare multiple distributions at the same time because you can plot many boxplots on one Figure. This is not really possible with histograms – any more than 3 and it starts to look crowded.
As this is an article about how to best work with boxplots, I will not go into detail about how I generated the datasets. However, if you want to follow along, I am using Seaborn’s tips dataset and you can find more info here.
Let’s assume you are a waiter/waitress at a restaurant and you have recorded the total bill in USD for each table you waited from Thursday – Sunday last week. You want to visualize this data to understand which days, if any, are the best to work. The total bill for all the days is stored in total_bill and the total bill for each day is stored in the variables thu, fri, sat and sun respectively.
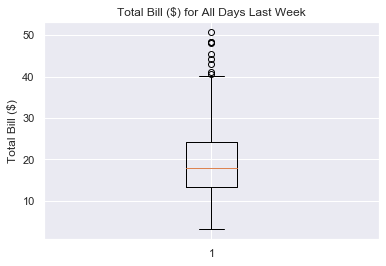
Let’s plot total bill and add some info to the axes and a title.
plt.boxplot(total_bill)

plt.title('Total Bill ($) for All Days Last Week')

plt.ylabel('Total Bill ($)')

plt.show()
This looks much better and it is now easy to understand what the boxplot is showing. We can see that the median bill for each table is about 17 USD and that the interquartile range (upper quartile – lower quartile) is from 24 – 14 = 10 USD. There are about 8 outliers where the bill was more than 40 USD and the lowest bill was about 3 USD.
Matplotlib Boxplot Multiple
Boxplots let you compare the distributions of different datasets. So, you will almost always want to plot more than one boxplot on a figure. To do this, pass the data you want to plot to plt.boxplot() as a list of lists.
# Create list of lists

all_days = [thu, fri, sat, sun] # Pass to plt.boxplot()

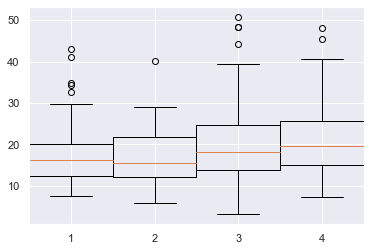
plt.boxplot(all_days)

plt.show()
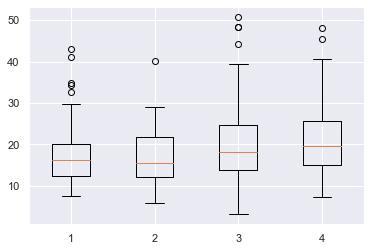
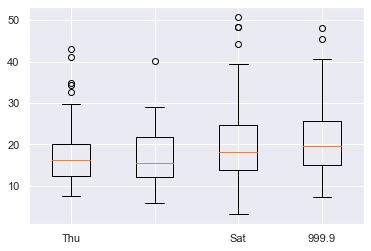
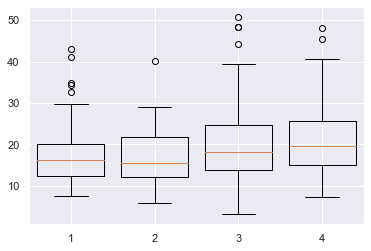
Here I combined all the individual datasets into a list of lists all_days and passed that to plt.boxplot(). Matplotlib automatically places the four boxplots a nice distance apart but does not label the x-axis for us. Let’s do that now.
Matplotlib Boxplot Labels
To label each boxplot, pass a list of strings to the labels keyword argument. If you have several labels, I recommend you create this first before passing it to plt.boxplot().
# Create data and labels first

all_days = [thu, fri, sat, sun]

labels = ['Thu', 'Fri', 'Sat', 'Sun'] # Plot data and labels

plt.boxplot(all_days, labels=labels)

plt.ylabel('Total Bill ($)')

plt.show()
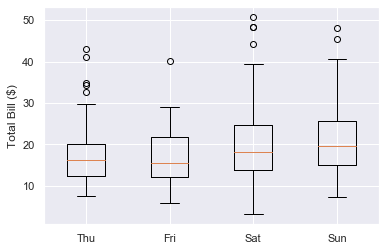
Great, now we can see that each boxplot represents the total bill for each day of the week and which day is which.
Make sure your list of labels is the same length as the number of boxplots and that you pass them in the order you want them to appear. If you don’t want to label a particular boxplot, pass an empty string ''. Finally, you can also pass ints and floats if you desire.
all_days = [thu, fri, sat, sun] # Second label is an empty string, fourth is a float

labels = ['Thu', '', 'Sat', 999.9] plt.boxplot(all_days, labels=labels)

plt.show()
Your boxplots look much better now but the matplotlib default settings are quite boring. It’s important to make your visualizations engaging and one of the best ways to do this is to add some color.
Matplotlib Boxplot Fill Color
To just fill the color of the box, you first need to set patch_artist=True. Why is this?
Under the hood, plt.boxplot() returns a dictionary containing each part of the boxplot and these parts are Line2D objects. However, by definition, these do not have an edgecolor or facecolor – lines just have one color.
To color inside the box, you must turn it into a Patch object which, by definition, has a facecolor.
To modify the box, use the boxprops (box properties) keyword argument. It accepts a dictionary and the key-value pair you need is 'facecolor' plus a color.
# Turn box into a Patch so that it has a facecolor property

plt.boxplot(total_bill, patch_artist=True, # Set facecolor to red boxprops=dict(facecolor='r'))

plt.show()
Note that if you don’t set patch_artist=True, you will get an error.
# Not setting patch_artist=True gives an error

plt.boxplot(total_bill, # Set facecolor to red boxprops=dict(facecolor='r'))

plt.show()

---------------------------------------------------------------------------

AttributeError Traceback (most recent call last)

<ipython-input-97-d28bb5a14c71> in <module> 2 plt.boxplot(total_bill, 3 # Set facecolor to red

----> 4 boxprops=dict(facecolor='r')) 5 plt.show() AttributeError: 'Line2D' object has no property 'facecolor'
If you also want to change the color of the line surrounding the box, pass the additional argument color=c for some color c to boxprops.
# Turn box into a Patch so that it has a facecolor property

plt.boxplot(total_bill, patch_artist=True, # Set facecolor and surrounding line to red boxprops=dict(facecolor='r', color='r'))

plt.show()
Perfect, now you know how to change the box’s color, let’s look at changing the other parts.
Matplotlib Boxplot Color
You can change any part of a boxplot to any color you want.
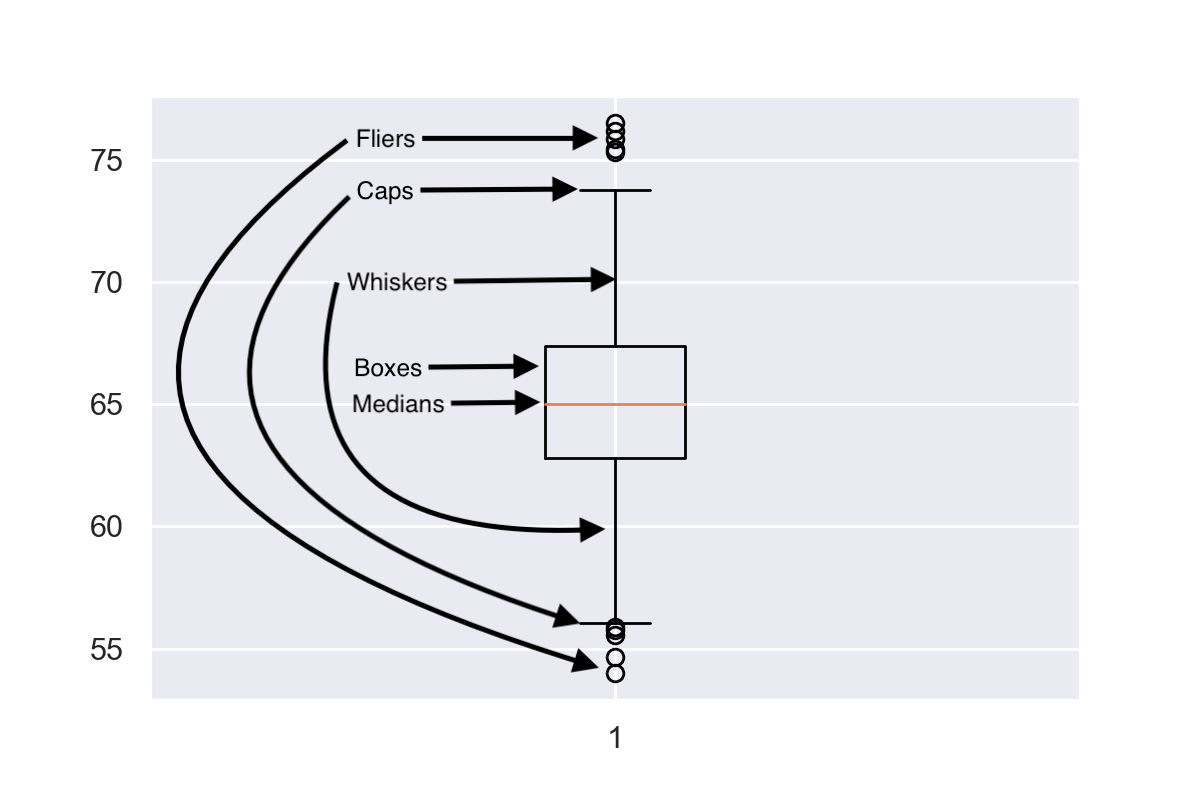
There are a 6 parts you can color:
box – the main body of the boxplot
median – horizontal line illustrating the median of the distribution
whiskers – vertical lines extending to the most extreme (non-outlier) data points
caps – horizontal lines at the ends of the whiskers
fliers – points above/below the caps representing outliers
mean – horizontal line illustrating the mean of the distributions (by default not included)
In the above image, I’ve labelled the first 5 parts but have not included the mean as it is not often used with boxplots.
Each of the parts can be modified by a <part>props keyword argument, similar to the boxprops one above.
For example, write this to set the color of the median line to red
medianprops=dict(color='red')
They all accept the color keyword argument and the value can be any matplotlib color string. The only different one is flierprops which also accepts markeredgecolor to color the line around the outliers.
Finally, remember to set patch_artist=True if you want to change the fill color of the box.
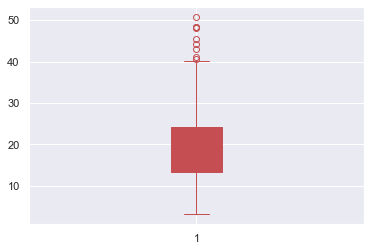
Let’s look at an example where I turn the entire boxplot red. Since there are so many keyword arguments to pass, I will first create a dictionary and use the ** operator to unpack it in my plt.boxplot() call.
# Set color to red

c = 'r' # Create dictionary of keyword aruments to pass to plt.boxplot

red_dict = {'patch_artist': True, 'boxprops': dict(color=c, facecolor=c), 'capprops': dict(color=c), 'flierprops': dict(color=c, markeredgecolor=c), 'medianprops': dict(color=c), 'whiskerprops': dict(color=c)} # Pass dictionary to boxplot using ** operator to unpack it

plt.boxplot(total_bill, **red_dict)

plt.show()
First I created a variable c to hold the color string in. This means that if I want to change the color to green, I only have to change one line of code – c = 'g' – and it will change the color everywhere.
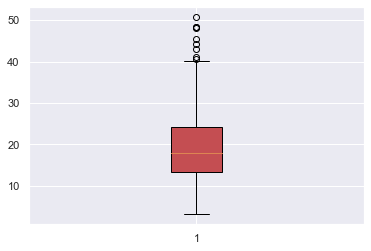
Then I created red_dict where the key-value pairs is a string and dictionary. The first key is patch_artists=True and the other keys are the <part>props keyword argument. Finally, I created a boxplot of total_bill and colored it red by unpacking red_dict with the ** operator.
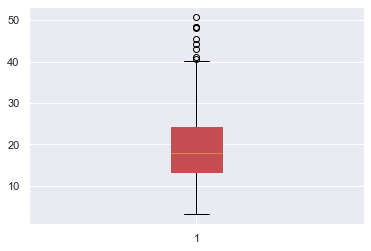
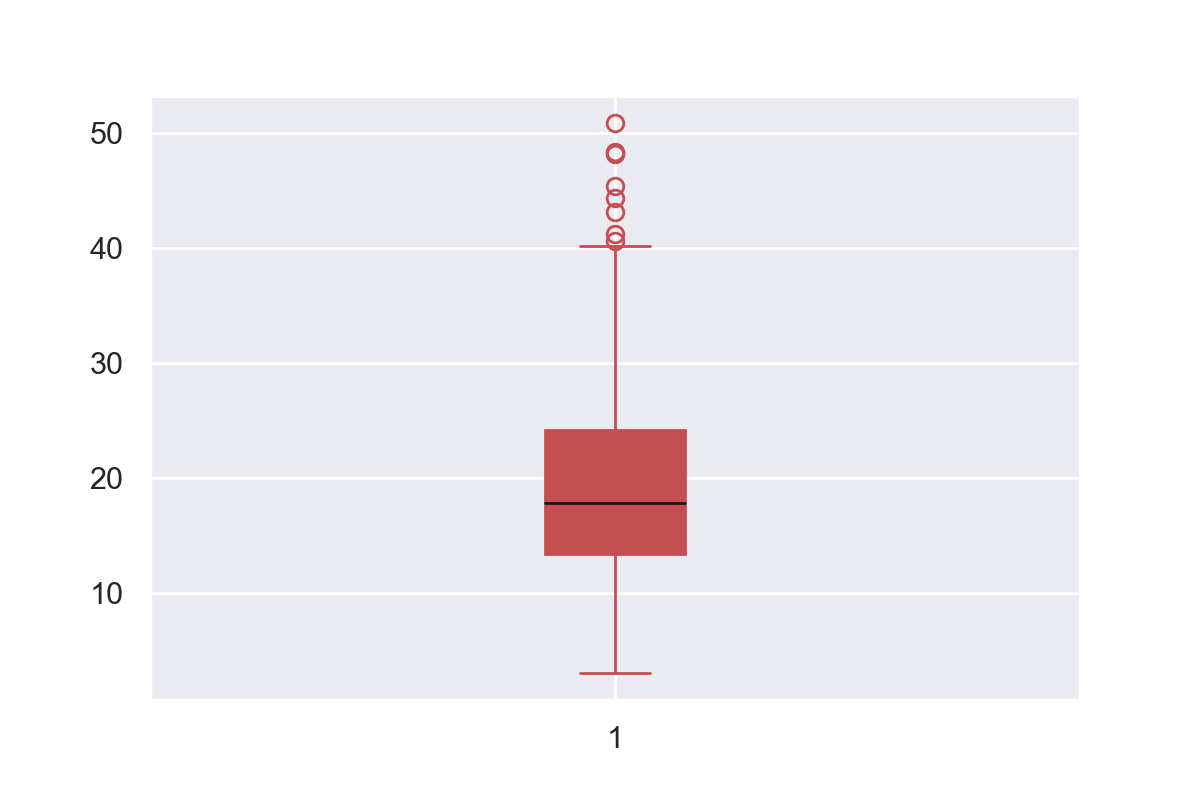
The red plot is much more engaging than the standard matplotlib colors. But, because the median line was the same color as everything else, you lost some information it was showing. One way to rectify this is to set to median line to black with'medianprops': dict(color='k') in red_dict. The result is shown above.
Matplotlib Boxplot Width
To change the width of a boxplot, pass a float to to the widths keyword argument in plt.boxplot(). It represents the fraction of space the box takes up on the figure.
If you have one boxplot, the scalar represents the percentage of the plot the box takes up.
plt.boxplot(total_bill, widths=1)

plt.show()
Here the box takes up 100% of the width as widths=1.
plt.boxplot(total_bill, widths=0.1)

plt.show()
Here the box only takes up 10% of the space as widths=0.1.
If you plot multiple boxplots on the same figure and pass a float to widths, all boxes will be resized to take up that fraction of space in their area of the plot.
# Boxes take up 100% of their allocated space

plt.boxplot(all_days, widths=1)

plt.show()
Here each boxplot takes up 100% of the space allocated as widths=1.
# Boxes take up 80% of their allocated space

plt.boxplot(all_days, widths=0.8)

plt.show()
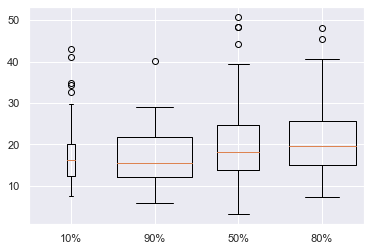
Here each boxplot takes up 80% of the space allocated to them as widths=0.8.
You can set the width of each boxplot individually by passing a list to widths instead of a scalar. In [83]:
Here I have labelled the amount of horizontal space each box takes up. Although it is possible to do this, I do not recommend it. It adds another dimension to your boxplot but isn’t showing any new information. I personally think that widths=0.8 looks best, but you are free to choose any size you want. Just make sure that your boxplots are the same width so as not to confuse your reader.
Matplotlib Boxplot Horizontal
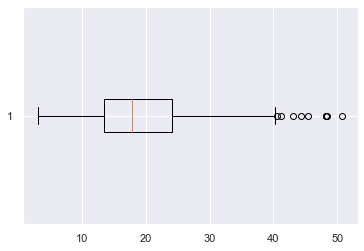
To create a horizonal boxplot in matplotlib, set the vert keyword argument to False.
plt.boxplot(total_bill, vert=False)

plt.show()
Conclusion
That’s it, you now know all the basics of boxplots in matplotlib!
You’ve learned how to plot single and multiple boxplots on one figure. You can label them whatever you want and change the color of any of the 6 parts to anything you can imagine. Finally, you’ve learned to customize the width of your plots and plot horizontal ones as well.
There is still more to be learned about boxplots such as changing the outlier marker, adding legends, sorting them by groups and even working with them and the pandas library. But I’ll leave that for another article.
Where To Go From Here?
Do you wish you could be a programmer full-time but don’t know how to start?
Check out the pure value-packed webinar where Chris – creator of Finxter.com – teaches you to become a Python freelancer in 60 days or your money back!
It doesn’t matter if you’re a Python novice or Python pro. If you are not making six figures/year with Python right now, you will learn something from this webinar.
These are proven, no-BS methods that get you results fast.
This webinar won’t be online forever. Click the link below before the seats fill up and learn how to become a Python freelancer, guaranteed.
Nintendo Of America Shuts Its Repair Centers To Prevent The Spread Of COVID-19
After the closure of Nintendo of America’s headquarters and the Nintendo store in New York, the company’s repair centers have now had to shut up shop due to preventive measures put in place to stop the spread of the coronavirus outbreak. Here’s the full statement:
Due to preventive measures put in place for the COVID-19 coronavirus, and in accordance with federal and local guidelines, our repair centers are closed until further notice. We apologize for the inconvenience and appreciate your understanding. Once repair services resume, we will work as quickly as possible to get you playing again.
Please note that, during this closure, products sent in for repair may be returned to you as undeliverable.
If our repair center has already received your product, it will remain there until repair services resume.
Repair centers over in the UK appear to still be operational, with the company revealing it was still “working hard” to maintain standards, but warning about potential delays:
We are working hard to maintain high customer service standards during the current challenging times, but please understand that there may be delays in responses to messages and processing repairs.
We would like to express our concern and support for all those affected by the COVID-19 outbreak during this challenging time. Thank you for your understanding and for your patience.
So, if you’ve got a Switch or something else you’re waiting for to be repaired, you might just have to wait a little bit longer.
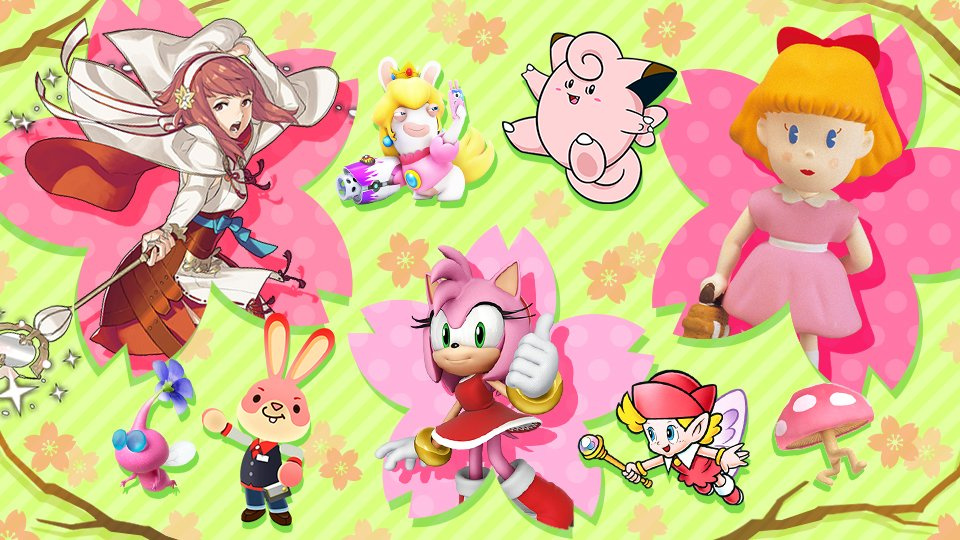
Smash Bros. Ultimate’s Cherry Blossom Spirit Event Celebrates All Things Pink
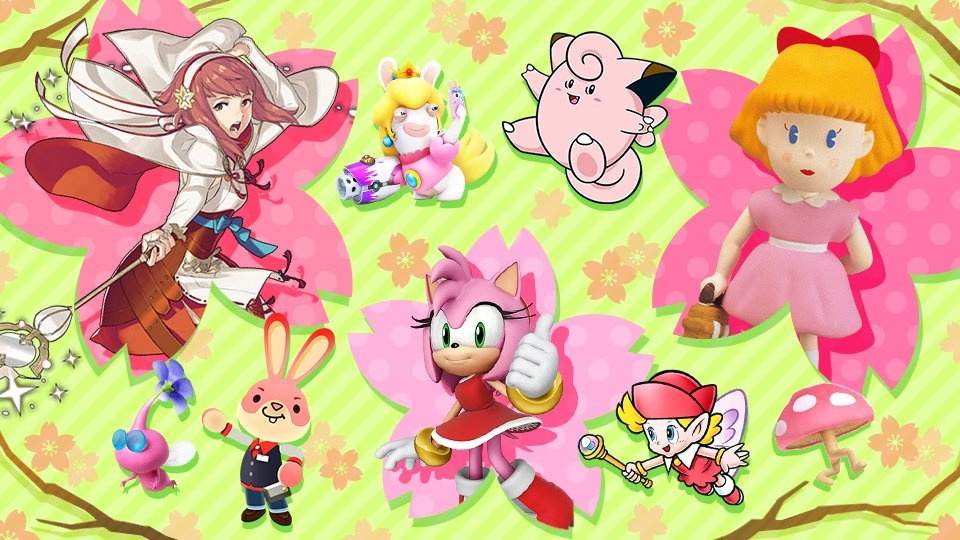
This week’s Super Smash Bros. Ultimate spirit event is focused on all things pink. Yep, starting this Friday, and running for a total of three days, is a brand new cherry blossom spirit event. This in-game event lines up with the trees blossoming in Japan right now.
During this one, you’ll be able to acquire spirits like Amy Rose from Sonic the Hedgehog, Clefairy from the Pokémon series, Paula from EarthBound and even that mildly annoying bunny from Nintendo Badge Arcade on the 3DS.
Will you be participating in this week’s spirit event? Leave a comment below.
We know you’re busy and might miss out on all the exciting things we’re talking about on Xbox Wire every week. If you’ve got a few minutes, we can help remedy that. We’ve pared down the past week’s news into one easy-to-digest article for all things Xbox! Or, if you’d rather watch than read, you can feast your eyes on our weekly video show above. Be sure to come back every Friday to find out what’s happening This Week on Xbox!
Xbox to Host Panel on Inclusive Game Design and Building a Welcoming Future in Games On Tuesday, March 17 at 11:35 a.m. – 12:15 p.m. PT, Xbox will host and stream a special panel focused on the importance of inclusivity in game design. Titled “Intentionally Inclusive Design: Building a Welcoming Future in Games,” the panel will feature relevant takeaways and tips for anyone… Read more
Assetto Corsa Competizione is Racing to Xbox One This June Today we bring the news so many sim racers have been waiting for! We’re thrilled to announce that Assetto Corsa Competizione, the Official GT World Challenge game, will launch on Xbox One June 23. The road to get here has been incredibly exciting for everyone at 505 Games and… Read more
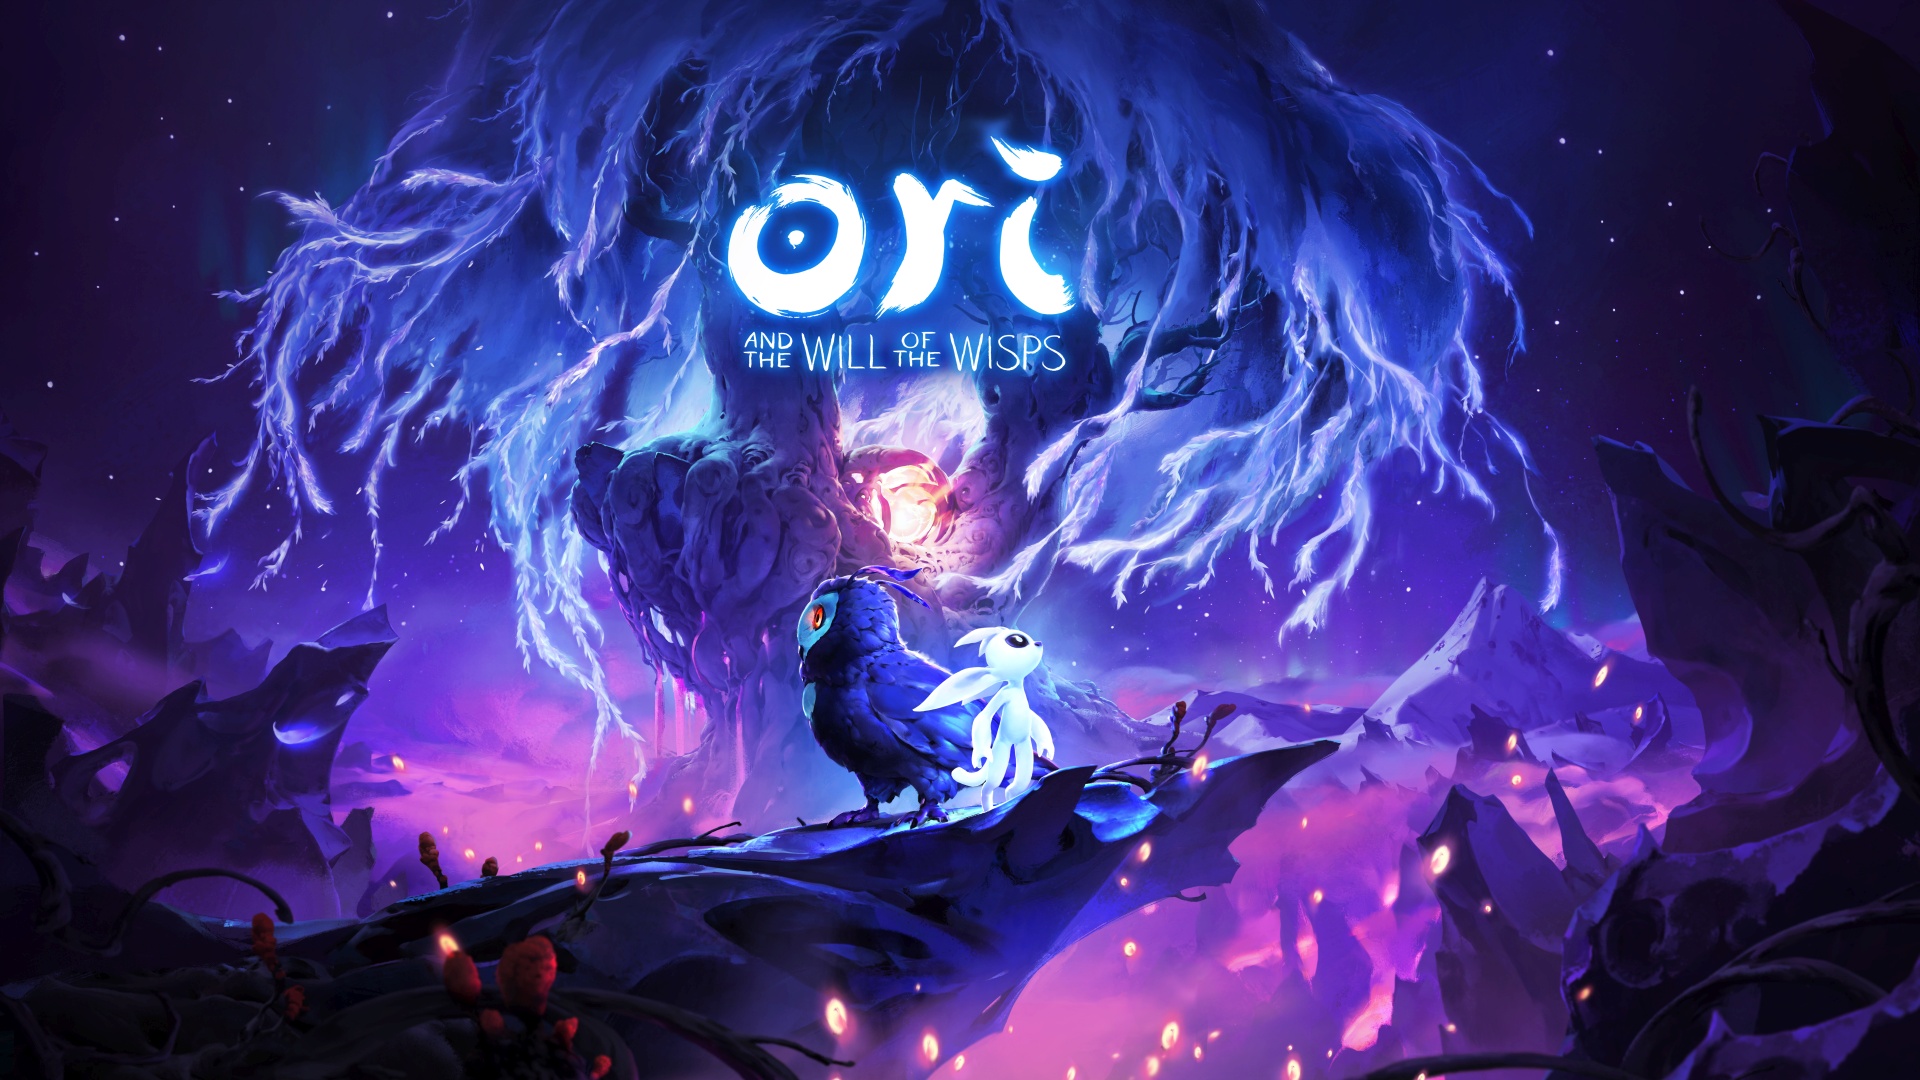
Ori and the Will of the Wisps Available Now Today, we welcome Ori fans on a brand new adventure through the Forest of Niwen as Ori and the Will of the Wispscelebrates its worldwide release with Xbox Game Pass and for Xbox One, Windows 10 PC and Steam! We’re incredibly proud of the game we’ve created and couldn’t be more excited… Read more
Your Lucky Stars Are Shining Bright in Trove on Xbox One Why, hello there, Trovian! It’s me, Qubesly! I’ve come with great news: St. Qubeslick’s Day is back, and with it your luck is on the rise. Come test your fortune in six new adventures that will have you leaping with joy at the rewards. Prove your mettle in clearing out infestations of darkness lurking… Read more
Your Dark Heart of Skyrim Adventure Begins with Harrowstorm Your next great adventure begins with The Elder Scrolls Online: Harrowstorm, now available on Xbox One. The first part of the new year-long storyline, Harrowstorm introduces two new dungeons for four-player groups: Icereach and Unhallowed Grave… Read more
Free Play Days – NASCAR Heat 4, Verdun, and Overwatch We’re back yet again with another intense Free Play Days lineup! Xbox Live Gold and Xbox Game Pass Ultimate members can play NASCAR Heat 4, Verdun, and Overwatch for free this weekend, from Thursday, March 12 at 12:01 a.m. PST until Sunday, March 15 at 11:59 p.m. PDT… Read more
Next Week on Xbox: New Games for March 17 to 20 Welcome to Next Week on Xbox, where we cover all the new games coming soon to Xbox One and Windows 10 PC! Every week the team at Xbox aims to deliver quality gaming content for you to enjoy on your favorite gaming console. To find out what’s coming soon to Xbox, read on below… Read more