Posted by: xSicKxBot - 11-04-2019, 01:03 AM - Forum: Lounge
- No Replies
Report: Amazon cracking down on third-party sales of Nintendo products
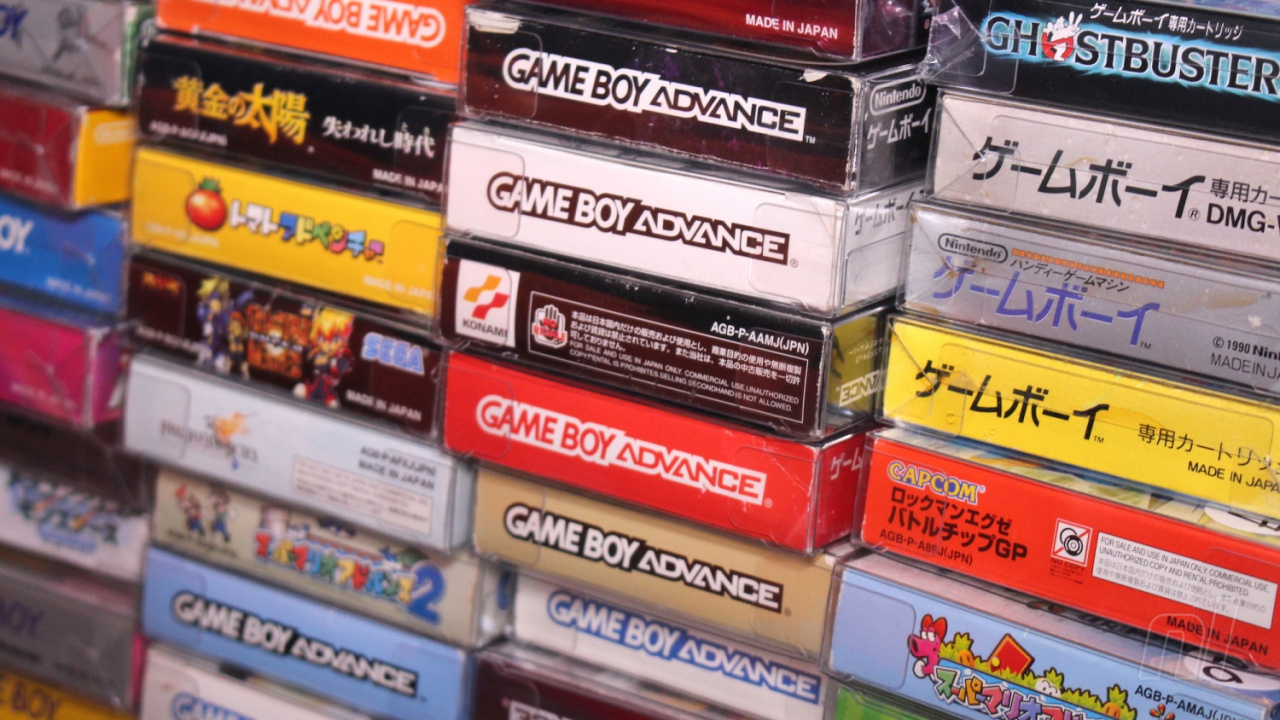
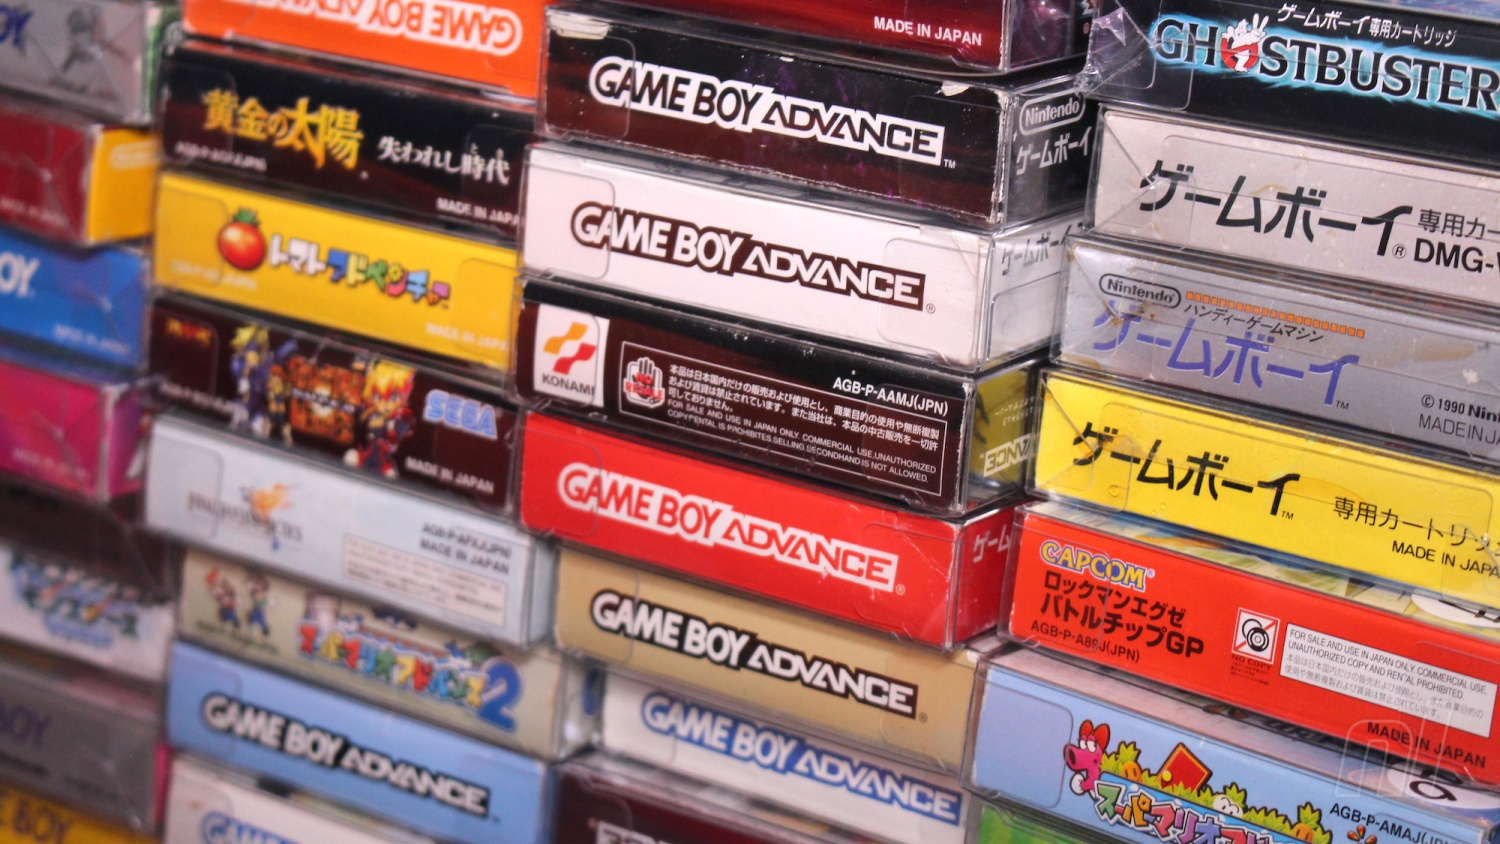
Some merchants who sell Nintendo products have reportedly received notices that they will need to get Nintendo’s approval if they wish to continue selling old and new Nintendo games and hardware on Amazon.
While neither Nintendo nor Amazon have yet publicly confirmed this, an email one vendor purportedly received from Amazon and passed on to The Verge spells out the new requirement and stipulates that “if you do not obtain approval to sell these products prior to 2019-10-31, your listings for these products will be removed.”
The vendor claimed they received the warning on the 31st, making it effectively impossible for them to contact Nintendo and get approval before the new requirement went into effect.
Gamasutra has contacted representatives of Amazon and Nintendo for confirmation and further clarification of this new requirement. If it remains in place, this will presumably put a stop to the lion’s share of used Nintendo games and hardware sales conducted via Amazon.
The Verge helpfully points out that this new arrangement is much akin to the deal Amazon hammered out with Apple this time last year, which saw Apple selling its products directly on Amazon while Amazon limited sales of Apple products to the company itself and its authorized resellers.
Posted by: xSicKxBot - 11-04-2019, 01:03 AM - Forum: Lounge
- No Replies
Hearthstone Battlegrounds is Blizzard’s card-based take on auto chess
Blizzard today announced the addition of a new major mode to Hearthstone, branding it Hearthstone Battlegrounds.
It’s a notable update to Blizzard’s digital collectible card game because it appears to be chasing the popularity of DotA Auto Chess and other games in the fast-growing” auto chess” genre.
Hearthstone Battlegrounds appears to pit 8 players against each other (in contrast to Hearthstone’s usual 2v2 format) and features a minion-recruiting mechanic seen in games like DotA Auto Chess and Riot Games’ Teamfight Tactics.
Blizzard’s Ben Thompson announced that the game mode would be released alongside Hearthstone‘s upcoming Descent of Dragons expansion, which is expected to debut December 10th; Hearthstone Battlegrounds will be available in an early access form starting next week, with an open beta expected to kick off November 12th.
Posted by: xSicKxBot - 11-04-2019, 01:03 AM - Forum: Lounge
- No Replies
Next Hero Confirmed For Overwatch 2: Sojourn
Capping off the Blizzcon 2019 opening ceremony, director Jeff Kaplan took the stage to reveal and detail Overwatch 2. It's sort of a sequel that features a roster of changes and new cooperative PvE modes; it'll also be playable with the original game's player base in competitive PvP modes. And one of the major reveals includes the confirmation of a new playable hero who has been in the background for a while. Her name is Sojourn.
Sojourn will join the roster of heroes for Overwatch 2
Kaplan stated that the team will not be talking about Sojourn in much detail during Blizzcon, but we do know a few things about her based on previous lore. She was a captain in the Overwatch organization who worked closely with the likes of Soldier 76, Tracer, Winston, and other. She also appears in Winston's "Recall" animated short and Ana's origin story. Sojourn has cybernetic enhancements, and while we know nothing of her abilities yet, her body augmentations are likely to play into her combat abilities. She's also the first Canadian hero on the roster (it's cool that we get to go to Toronto as a new map, too).
You can catch up on all the announcements made at Blizzcon 2019, including more details on Overwatch 2 in our stories below:
As always, members of team Nintendo Life have gathered together to discuss their weekend gaming plans and we’d love for you to join us via our poll and comment sections below. Enjoy!
Liam Doolan, news reporter
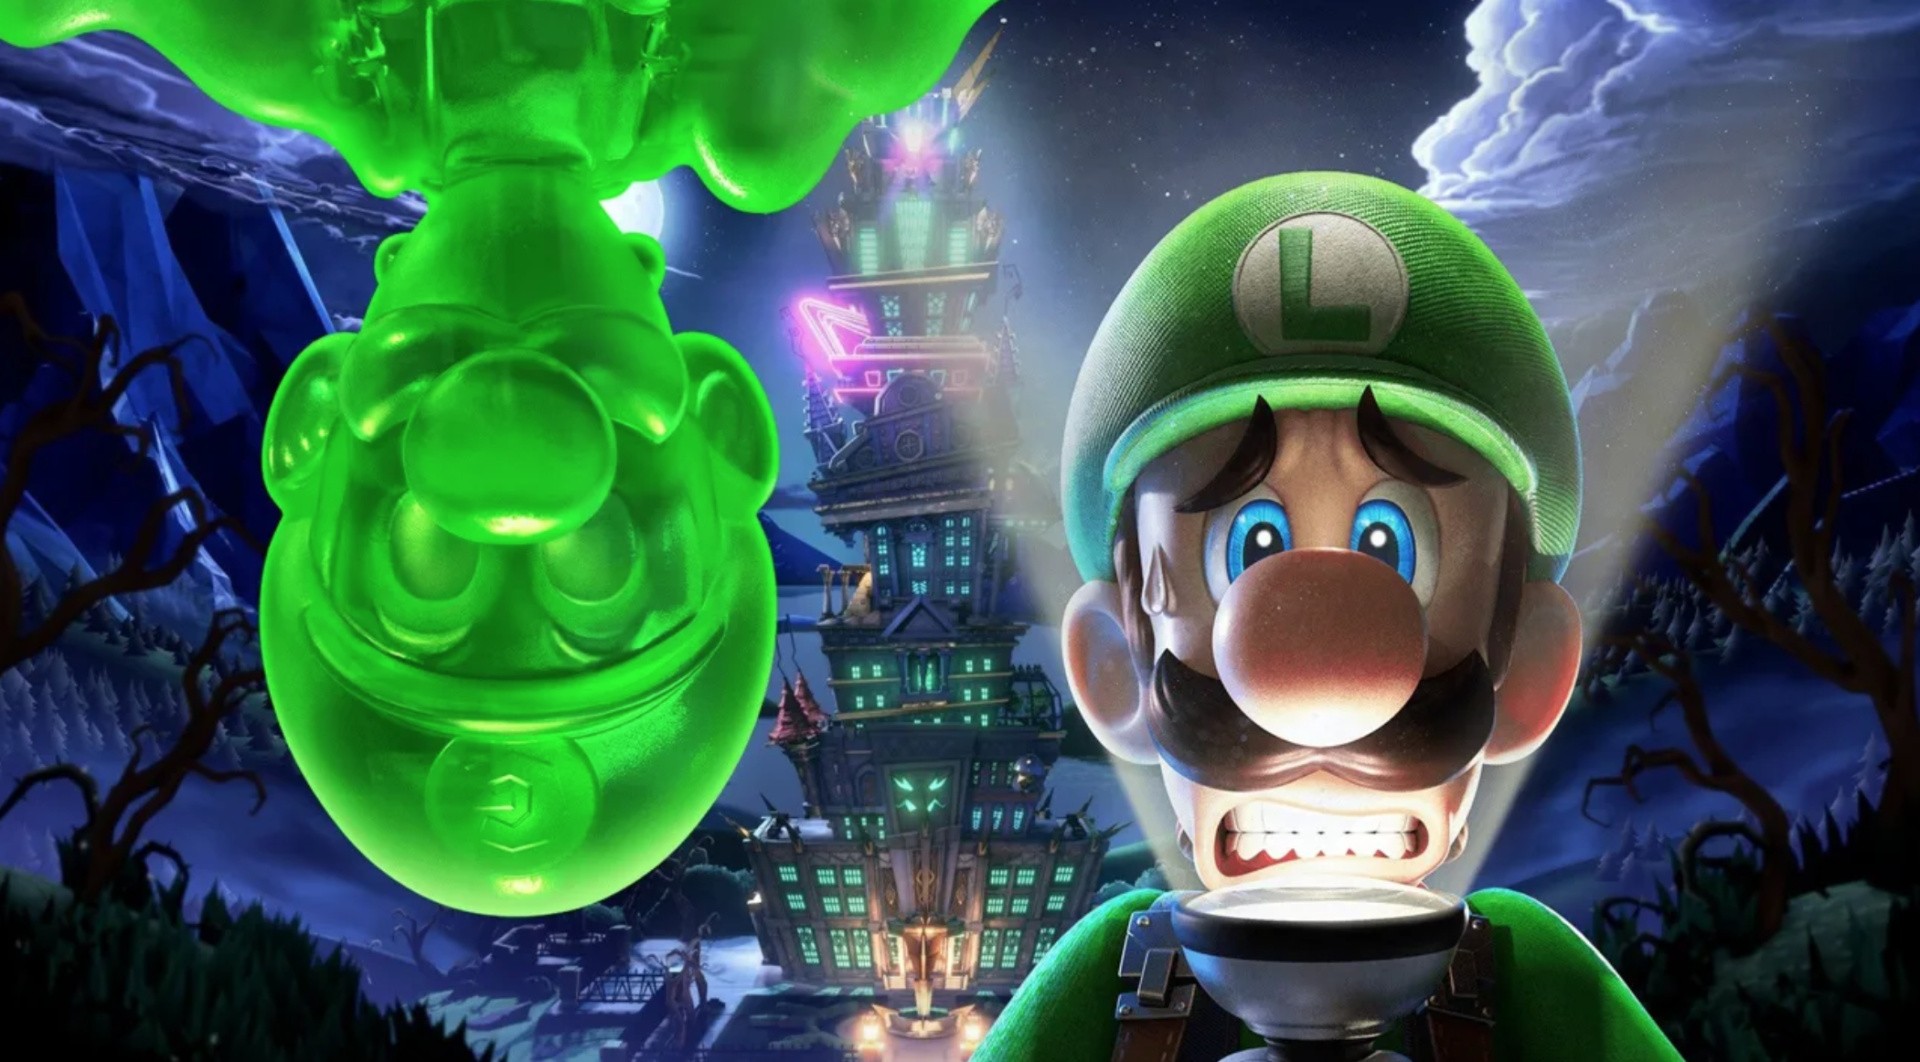
My main gaming focus this weekend will be Luigi’s Mansion 3. I’ll admit, I wasn’t particularly fond of the second outing on the 3DS, but I absolutely loved the GameCube original – it was such an appropriate title for the system’s comfortable controller. I even played this game multiple times over, as short as it was. The spooky vibes I’m getting from the third game so far seem a lot more promising than the dedicated handheld sequel, so I’m going to go ahead and say right now that Luigi’s new ghostbusting affair could end up becoming my favourite entry in the series.
If I get any extra time, I might boot up Super Monkey Ball: Banana Blitz HD and drive myself bananas. As rough around the edges as it is, it’s been good fun revisiting a Wii game through an HD lens.
Zion Grassl, video producer
This month has been pretty wild with its Switch releases, giving me too many games to play. After many hours of fun and frustration, I finally rolled credits on Super Monkey Ball: Banana Blitz HD, which feels good to put behind me because I feel that I start so many games these days but never finish them.
So I’ll probably try to dive into my backlog a bit this weekend to finish a few games that I’m at the tail end of, like Astral Chain or Hotline Miami Collection. I’d also try to fit Ring Fit Adventure into my schedule, but I’m travelling out of town this weekend and I think it’s best advised I don’t try playing it in the car.
Austin Voigt, contributing writer
This weekend, I will absolutely, positively not be playing Luigi’s Mansion 3. It doesn’t look like any fun, it isn’t festive or seasonal in any way, and I hate being able to pet cute Polterpups. I ESPECIALLY cannot stand hearing Charles Martinet as Mario saying “doggy!” That time I met him at E3 while he was promoting the game, and he did a Luigi impression for me? Made me even less excited for this game. Gooigi? Gross, green jello is the very worst of the flavors. Haunted hotel? It’s not even that scary, guys. 1/10, more like Lame-igi…
So yeah, I’ll be playing Luigi’s Mansion 3 all weekend long – and forcing all of my friends to play it, too.
Ryan Craddock, staff writer
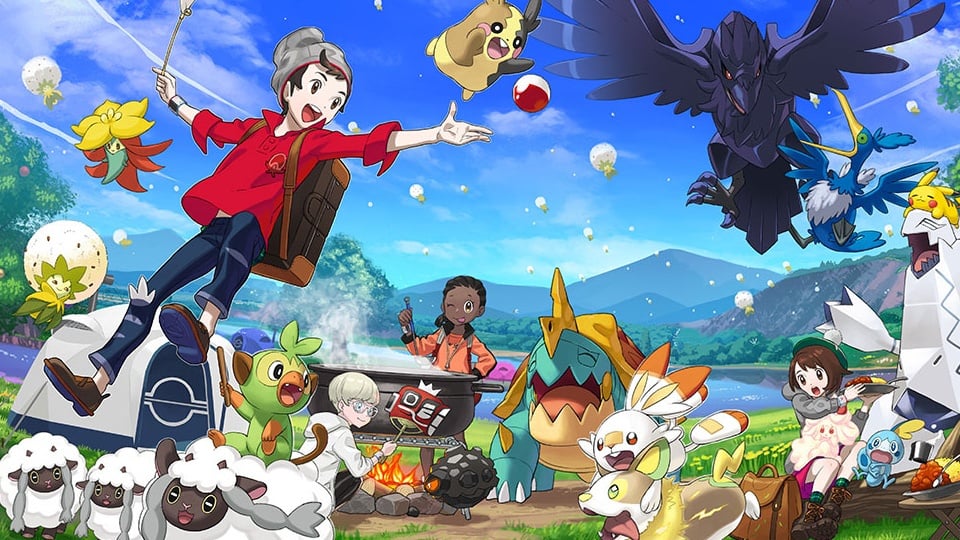
Against my better judgement, I’ve actually managed to hold off from buying Luigi’s Mansion 3 at launch. I’m incredibly eager to get stuck into it, but I’m still working my way through Yooka-Laylee and the Impossible Lair and I’ve set aside an entire week after Pokémon Sword and Shield launch to play my chosen version all day long every day.
The goal, therefore, is to play through more of Yooka-Laylee over the weekend in an attempt to complete it – I’ve nearly played through all of the levels so will soon be taking on the final boss – and then maybe start dipping in and out of Super Monkey Ball: Banana Blitz HD until Pokémon arrives. Don’t worry though, Luigi, you’ll likely be my Christmas period entertainment!
Gonçalo Lopes, contributing writer
A rare three-day weekend for me would mean further smooth The Witcher 3: Wild Hunt progress but the arrival of parcels from the Far East means that Super Robot Wars V (in English!) is also part of my weekend. I urge any fan of Space Battleship Yamato to seek it out. Do you think it will be this weekend I complete DAEMON X MACHINA and Astral Chain? Probably not, but most certainly not for the lack of trying.
My game of the week is obviously the magnificent, spooktastic Luigi’s Mansion 3. Congratulations to Next Level Games for fully realizing the franchise’s potential. This year I even broke off the SNES marathon tradition just to have more free time to further play this new vacuum cleaner chronicle.
Gavin Lane, staff writer
This weekend I’m in need of something restorative following a mid-week bout of the dreaded lurgy. It can be hard to find a game that strikes the right balance if you’re not firing on all cylinders – something you don’t have to think too hard about but still feels rewarding. Mega Drive Sonic games are my usual go-to, but I think a little trip to Hyrule in Breath of the Wild would be just the ticket this weekend. I’ve got a several dozen more Korok seeds to find, but just burning around the hills on my Master Cycle Zero is fun enough to pass a few hours as the ol’ batteries recharge. Lovely.
Which games are you playing this weekend? (348 votes)
BlizzCon 2019: Blizzard Addresses Hong Kong Hearthstone Banning Controversy
It's been a wild couple of weeks for Blizzard, following the company's decision to punish professional Hearthstone player Ng Wai Chung (aka Blitzchung) after he used a post-match interview to express his support of the Hong Kong protests. Though Blizzard already released an official apology for its actions, the company took advantage of its platform at BlizzCon 2019 to further address the situation, although it didn't acknowledge any specifics about what it had done.
"Blizzard had the opportunity to bring the world together in a Hearthstone tournament," company president J. Allen Brack said. "We did not. We moved too quickly in our decision making, and to make matters worse we were too slow to talk with you. We didn't live up to the high standards we really set for ourselves, and second, we failed in our purpose. I'm sorry, and I accept accountability."
Brack went on to talk about BlizzCon being an opportunity to showcase the global community for its games, and promised, "We will do better going forward."
In response to the original ban against Blitzchung, a protest was organized that is currently ongoing just outside BlizzCon. "That Blizzard has shown a willingness to re-evaluate their decision is a small step in the right direction, but make no mistake; Blizzard continues to punish these individuals despite widespread outrage from gamers around the world," protest organizer Dayton Young said in a statement to GameSpot.
"We understand that game publishers and developers have a responsibility to moderate the content that appears on their platforms to ensure that gamers are safe from harassment, threats of violence, and other dangerous behavior," he continued. "But silencing gamers who speak up about issues that affect their freedom makes us all less safe from oppression and institutional abuse."
Video: 13 Exciting New Games Coming To Nintendo Switch In November
When he’s not paying off a loan to Tom Nook, Liam likes to report on the latest Nintendo news and admire his library of video games. His favourite Nintendo character used to be a guitar-playing dog, but nowadays he prefers to hang out with Judd the cat.
The Haxe Programming Language just hit a major milestone with the release of version 4.0.0. The programming language gains several new features such as:
New function type syntax
Arrow function syntax
final keyword
New and faster Haxe built-in interpreter
Unicode support on all targets
Key-value iterators
Auto-“using” for types
IDE services protocol for better IDE support
New high-performance run-time HashLink, a successor of Neko
.. and much more!
Check the complete What’s New Guide for a full list of changes in this release, including possible breaking changes from Haxe 3.x. There is a thriving ecosystem of game engines and frameworks for Haxe which we showcased here. Of particular interest are the Blender based Armory3D engine (tutorial series here) and the popular and mature 2D frame HaxeFlixel (tutorial series here).
You can learn more about the Haxe 4.0.0 release in the video below.
Ad companies say Apple is taking a ‘slow roll’ in promoting Apple TV+
By William Gallagher Saturday, November 02, 2019, 08:03 am PT (11:03 am ET)
Figures for television and online advertising show Apple typically spending around half as much on promoting Apple TV+ as on the iPhone.
Apple TV+ is now available on iOS devices, Macs and Apple TV hardware
According to the New York Times, Apple‘s marketing of Apple TV+ has been “muted” compared to how Disney+ is being promoted. While there are no details for Disney’s spending, on figures available for September and October, Apple spent around twice as much advertising the iPhone than it did Apple TV+.
In September, Apple reportedly spent $28.6 million on iPhone television ads, compared to $14.9 million for Apple TV+
As might be expected, that figure went up in October as the service’s November 1 launch date approached, but the proportions were approximately the same. In October, Apple spent $19.9 million advertising Apple TV+ on television, but it spent $38.6 million on iPhone adds.
The figures are closer for online ad spending and in September, Apple TV+ promotions actually cost more. Apple paid an estimated $3.8 million for online Apple TV+ ads, compared to $2.4 million for iPhone ones.
However, in October, online iPhone ads cost Apple $2.3 million, while it is believed to have spent $1.7 million on Apple TV+ ones.
The New York Times quotes analyst Dan Rayburn of business consulting firm Frost & Sullivan, saying that Apple is right to hold back on its advertising.
“Consumers are just drowning in content right now,” he told the Times, “and all of these services are competing for our time. But they’re all approaching the market differently. This isn’t some race for Apple. It’s a slow roll.”
However, analyst Daniel Ives of Wedbush Securities told the NYT that he believes the Apple TV+ marketing has been unusually “aggressive” for Apple.
“This is a pivotal juncture for Apple to be successful,” he said. “They cannot trip over their shoelace. They were late to the game, they’ve underinvested in content, and they have a lot of room to make up.”
The New York Times report was first spotted by 9to5mac.
Mark your calendars, Guardians, because October 29 is a day filled with updates that will appeal to just about every player in this community. We have a full menu of activities to tackle, challenges to master, and Exotic loot to add to your collection.
Festival of the Lost is about to return. We have a full preview of the festivities Guardians can look forward to next week. The Moon isn’t the only thing that’s haunted. The Haunted Forrest will be back, and the Tower will be spookier than ever.
A new dungeon is also opening up to willing fireteams or brave Guardians who want to tackle it alone. Speak with Eris; she knows the way.
The Crucible is about to gain some momentum as well, changing the way Guardians meet in glorious combat.
Earlier this week, Banshee sent Season Pass owners out on a quest to claim the Leviathan’s Breath Exotic Bow. If you haven’t completed the quest yet, check this out.
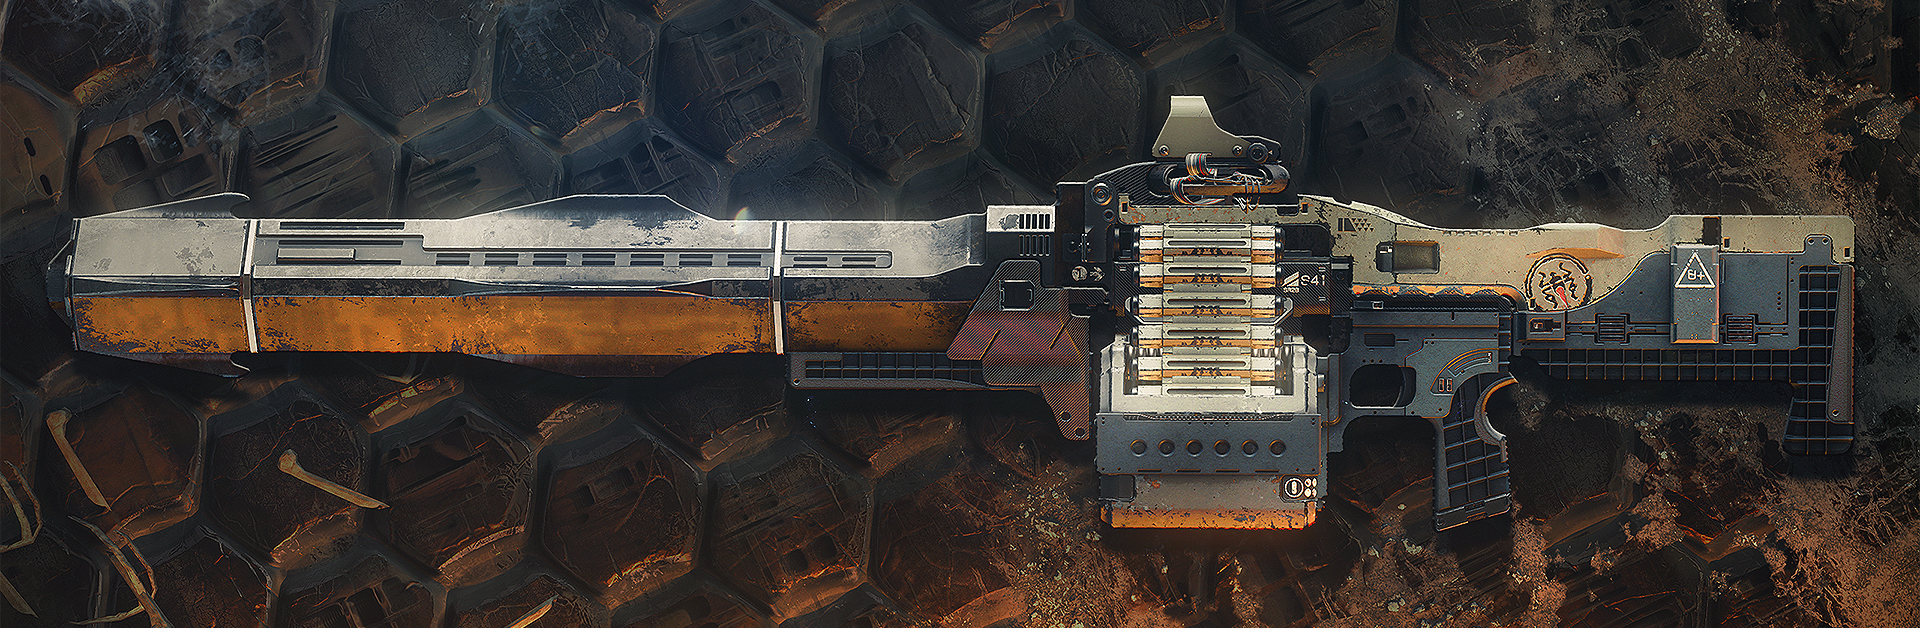
On top of all that, there’s another Exotic quest going live for Shadowkeep owners. You may have seen pictures of a replica we had made of the “bug gun” from past events. It’s time for you to go out and claim the Xenophage as your own.
Where will your path take you first? There will be many options for you to consider, depending on how you like to play the most.
Continue the Momentum
Next week, Lord Shaxx is mixing things up in the Crucible with a new mode called Momentum Control. While Mayhem puts focus on Supers, Momentum shifts your focus to gunplay. This is a fast-paced, hair-on-fire experience where the lethality of all weapons has been cranked to 11. You’re incentivized to be aggressive as you defeat other Guardians to earn charged melees, grenades, and Supers. Here’s a quick rundown of what to expect:
Instant Respawn Times
Out of the fight? No problem; drop right back in immediately
Weapon Damage Increased
Higher combat lethality
Everything in your arsenal is a contender
Ability Regen Requires Effort
Defeat enemy players to charge your melee, grenade, and Super
No Tracker
Sneak around your enemies for some sweet flanks
Amped Control
Zones capture faster and grant more bonus points per kill
Super Charged Supers
Increased damage resist in Super means you become the 1,000-pound gorilla
Be careful, because Heavy weapons will put you down quickly
The Heaviest of Ammo
Increased Heavy ammo respawn rates and drop amounts
Many of us who have been playtesting this have compared it to the classic Halo custom game SWAT, but for Destiny. We’ve done a lot of trying out different weapons and seeing how they behaved in this heavily modified sandbox of a mode.
Momentum will be the featured 6v6 rotating playlist during Festival of the Lost. We’ll be monitoring the community’s response to see when we want to bring it back.
Looking forward to hearing your feedback.
Triumphant
Now that we’re neck deep in Season of the Undying, we wanted to talk about some changes to Seasonal Triumphs in the third year of Destiny 2. You may have noticed some of the changes to the system and the Destiny Dev Team wanted to let you know some of our thinking behind why we are adjusting Triumphs going forward.
Destiny Dev Team:
As always, we start with the goals:
Provide more tiers of pursuit for players
Provide Seasonal pursuits that match each Season of Destiny
Ensure everyone has a chance to show off their accomplishments
What’s in a Triumph Tier?
Starting with Shadowkeep, individual Triumphs can now have tiers. They grant a portion of its total Triumph score as you make progress toward the final Triumph. For example, consider the SEASON 8: POWER BONUS Triumph. It has three tiers. To earn the first tier, you need to gain 5 points of bonus Power from your Season 8 Artifact, the Gate Lord’s Eye. Once you do, you’ll get 10 points of Triumph score toward your account’s total Triumph Score, and the next tier will be revealed to you.
As part of this release, we went through all the existing Triumphs in the game and added in tiers to Triumphs where they made sense.
A Title to Match the Season
This is probably too much homework, but the “An Evolving World” section of Luke’s Director’s Cut—Part III is essential reading. The CliffsNotes version as it pertains to titles? Okay, we’ll try. Prior to Season of the Undying, each piece of the Annual Pass added parts of the game designed to live on forever. During Season 8, a new situation will unfold on the Moon. Over the course of the Season, the situation will be resolved and some of the related activities will go away as Season 9’s conflict arrives.
This will also be true of the Title associated with Season 8. Both the Triumphs and Badge for the new title will ask players to be participate during the Season of the Undying. Once the conflict has been resolved players will no longer be able to earn the season’s title, Undying.
New Light and Getting ALL the Score
New Light forced us to think about many of the existing Triumphs and evolve our philosophies around what Triumph Score represents. For example, when a New Light player joins the game, should they receive all the score for getting to level 50 without having to put in any effort? That doesn’t feel like much of a Triumph. That said, shouldn’t a new kinderguardian have a chance to have the magical moment where they hit max score? Also, our evolving world will lead to many Triumphs that will no longer be able to be earned. Yet, we’ve heard loud and clear that Triumphs without score aren’t very compelling. The rules had to evolve.
The decisions!
Pre-Shadowkeep Triumphs that no longer require effort can’t be earned after Season 7.
These Triumphs have had their score reduced to 0.
The players who have earned them will still see them in their Triumphs.
Seasonal Triumphs will have a score value. If you miss Triumphs during Season of the Undying, you may not be able to max out your score for the year.
Even with an evolution to our Triumph philosophy, we don’t think we’re done making tweaks to the system. Not everything is as clean as we’d like it to be in order to support Destiny as an evolving world. We’ll be listening closely for feedback as we consider how to best continue the evolution of Triumphs.
Color Your Words
Accessibility is something we’re always trying to improve in Destiny. We have some new changes coming next week to make subtitles easier to read. The Destiny Dev Team is here to tell you more!
Destiny Dev Team: Have you ever found yourself wishing the subtitles were bigger, or liked having them on but thought they took up too much space, or wanted them to be a different color?
It has always been important for us that we make Destiny’s UI accessible to the widest range of possible players as we can. Later this month, we’ll be releasing an update that adds more options to let you change the look of subtitles in Destiny. Five different sizes to pick from, a variety of text colors, and a few different styles for the background.
These new subtitle settings are found in the settings tab under “Gameplay” on PC and “Accessibility” on consoles, and they’re present in new users’ initial log-in experience. We’ve also taken this opportunity to consolidate some PC settings into five subsections.
This is just one focused update on increasing accessibility options in Destiny, with plans for additional updates in later releases. (A small example that didn’t quite make this next release is a fix for subtitles disappearing when navigating between menus). We’d love to hear your feedback on these changes, as well as what other accessibility improvements are important to you.
Ready for the Runway
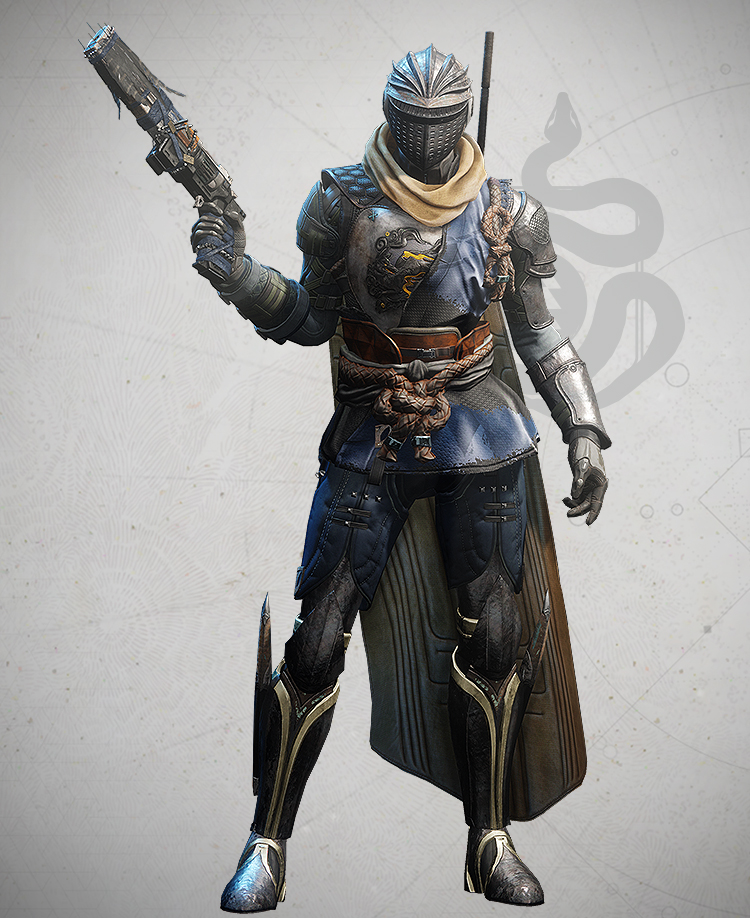
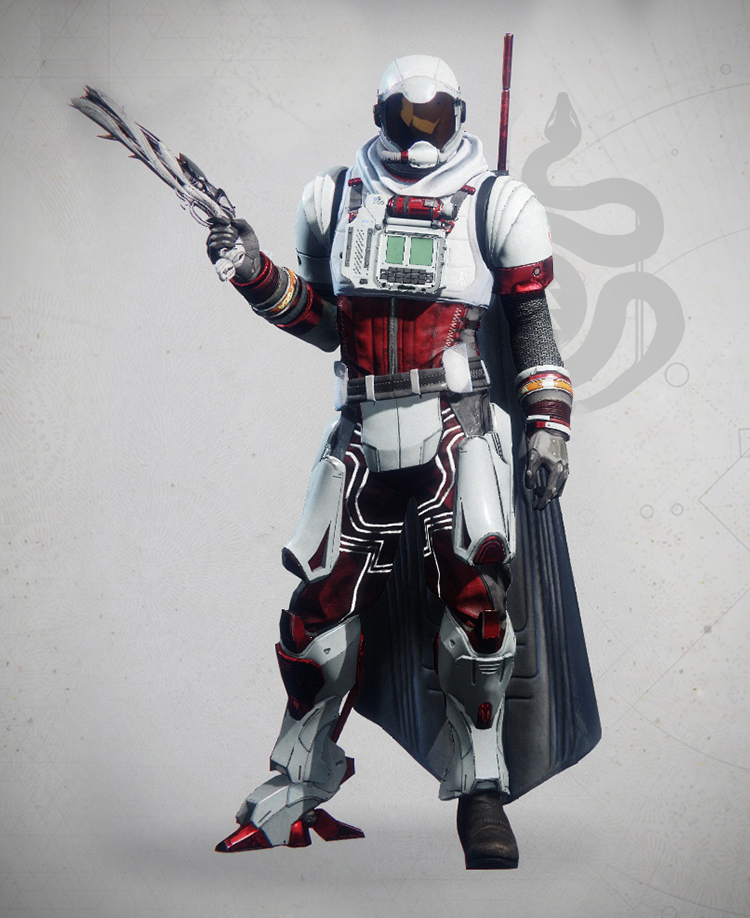
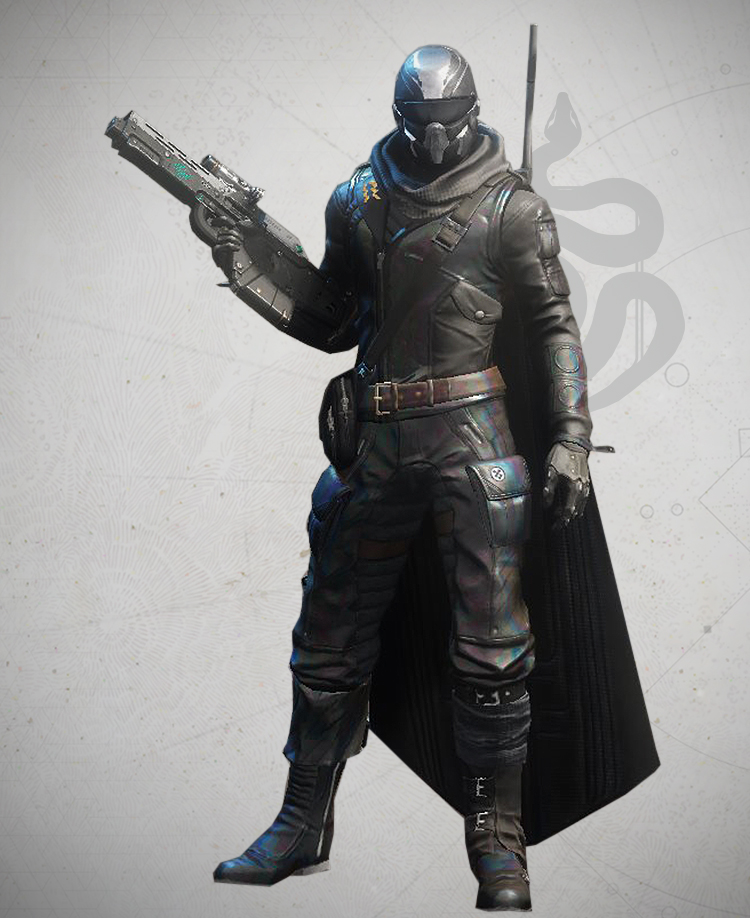
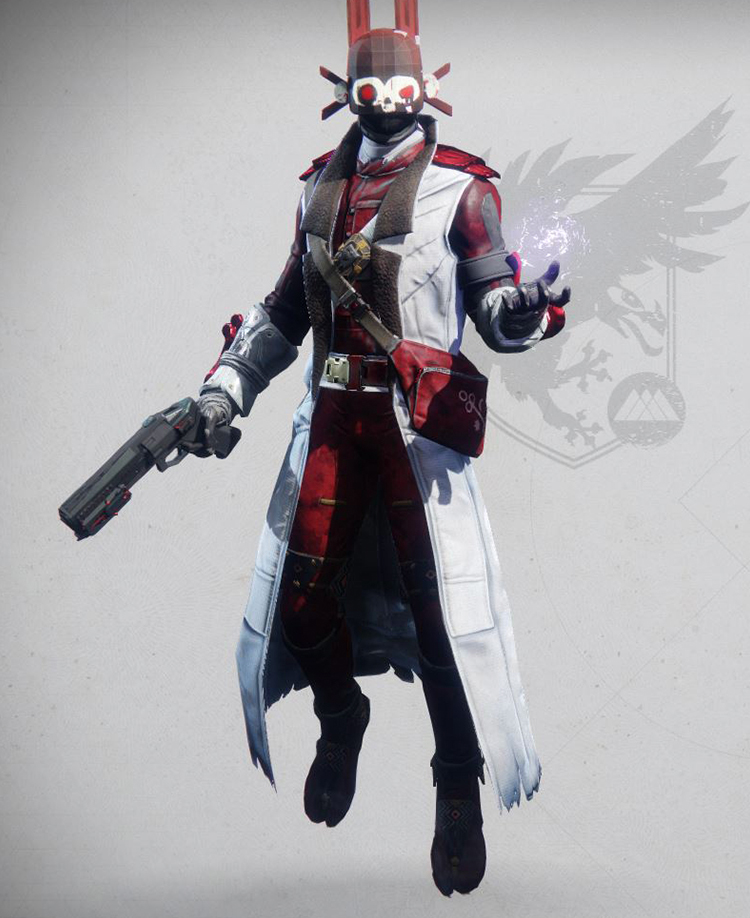
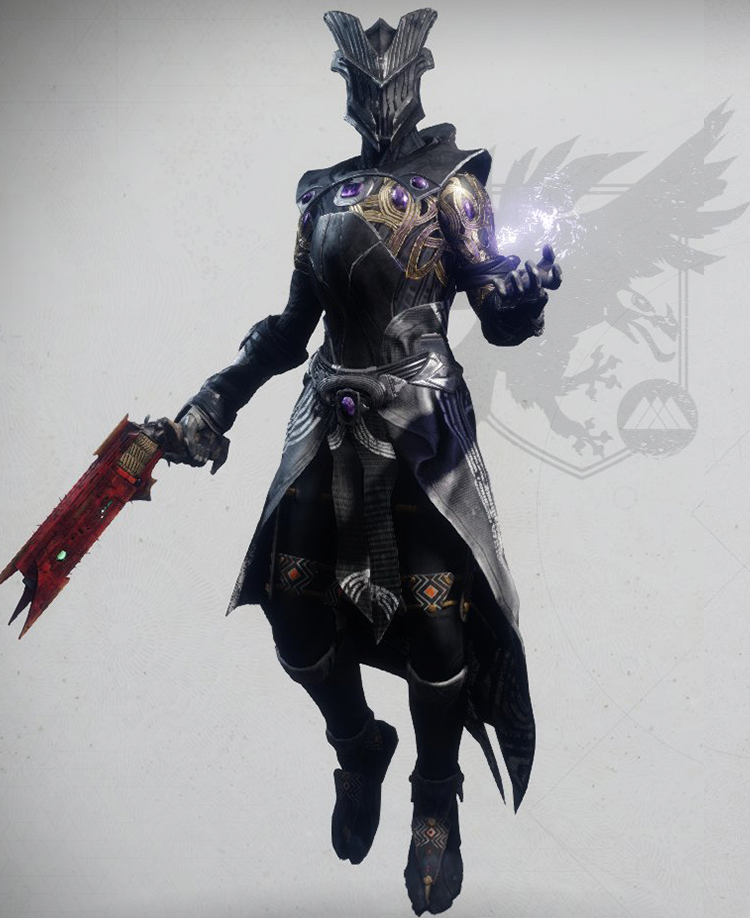
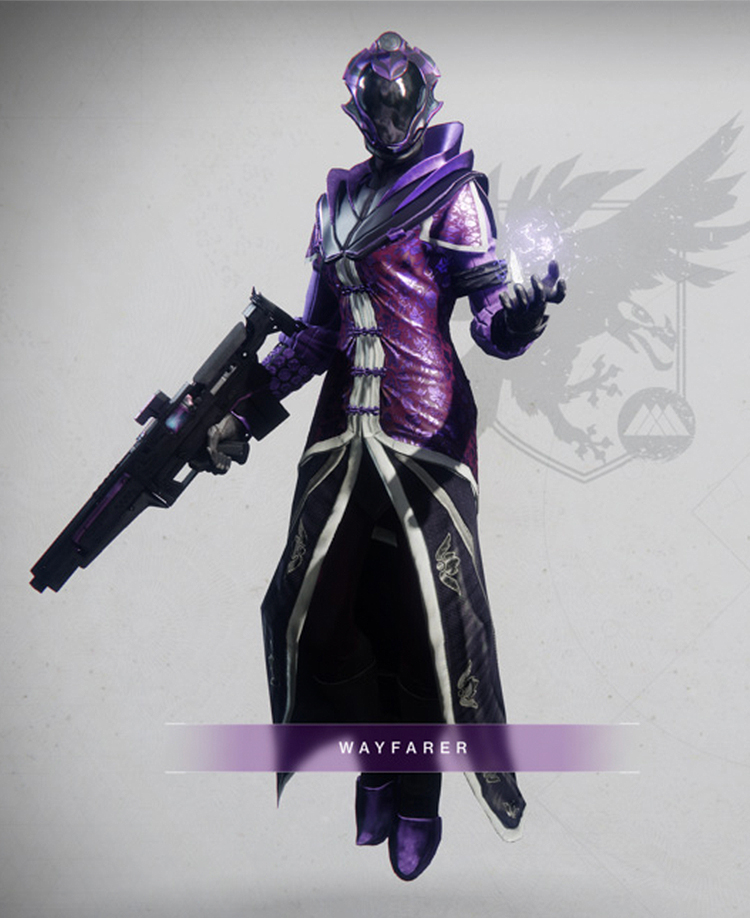
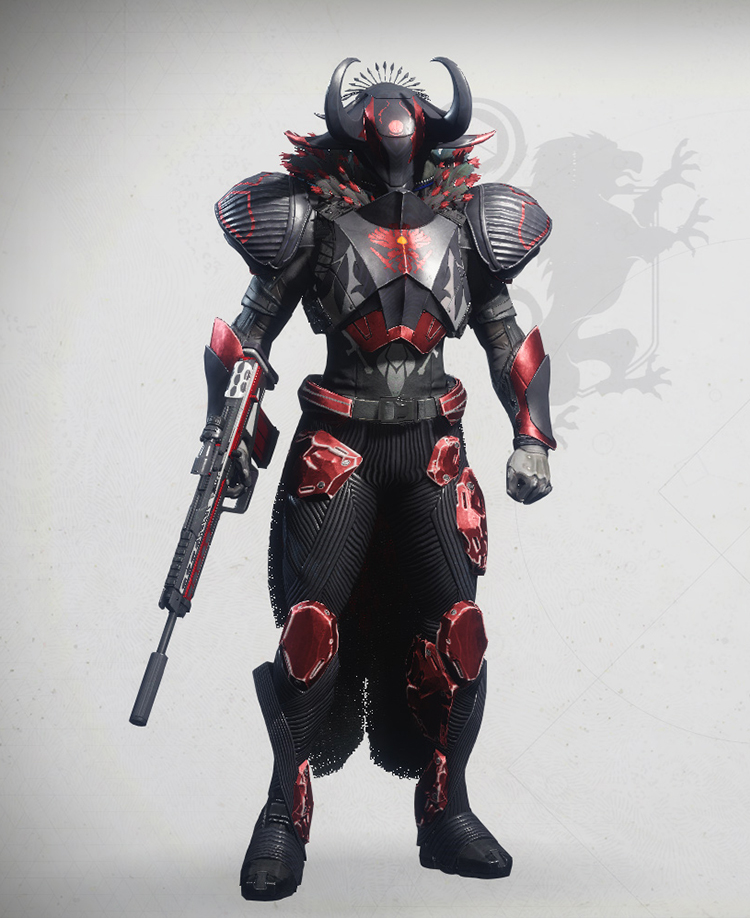
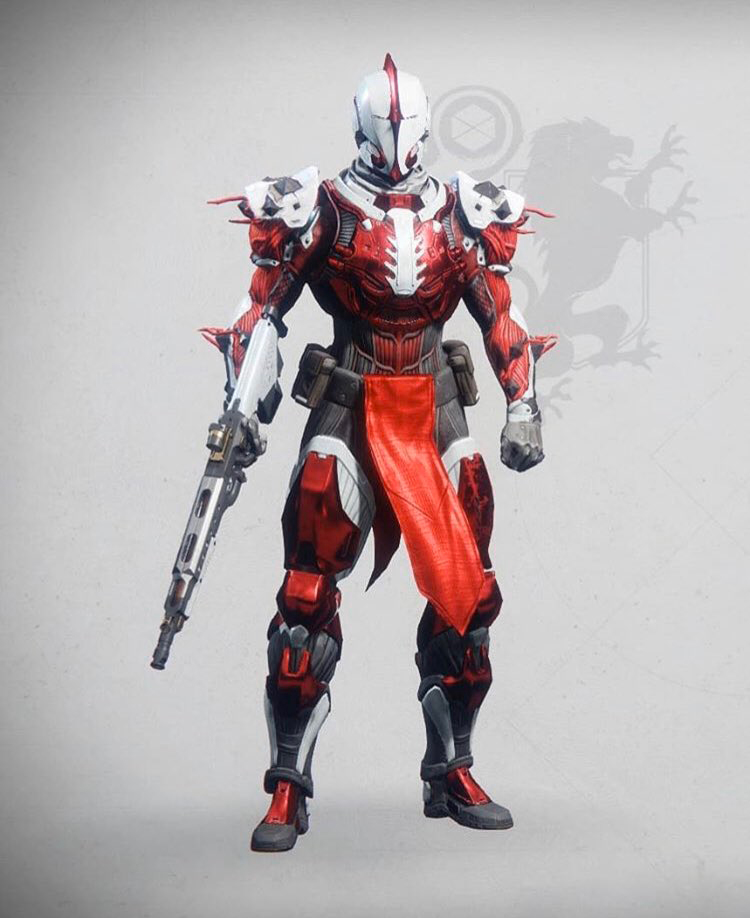
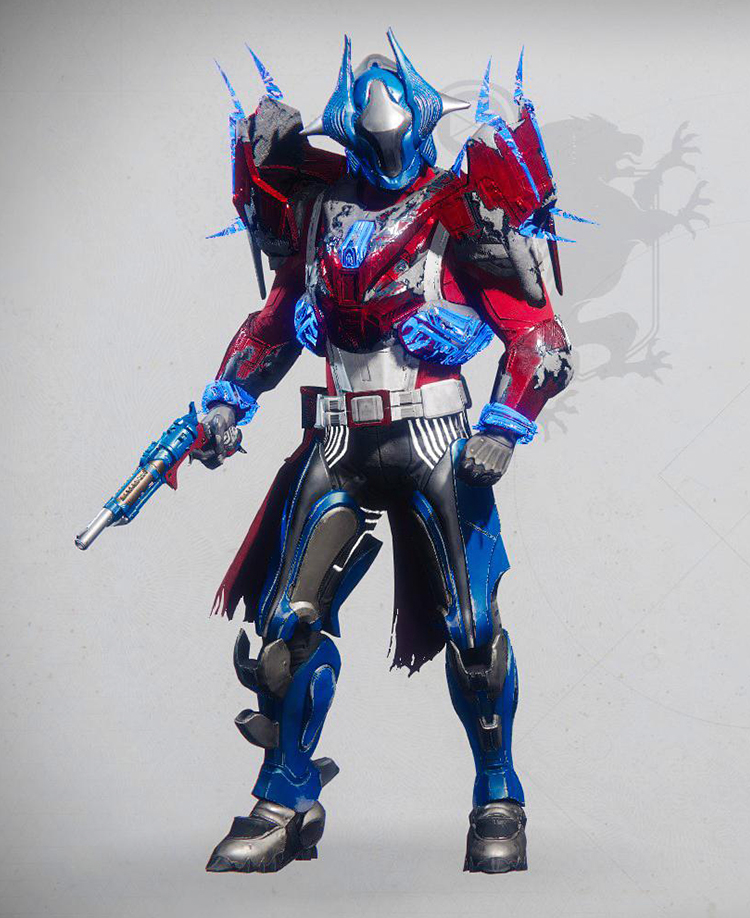
Last week, we put out the call for all fashion-focused Guardians to put on their best threads for Fashion Week. We have an esteemed panel of judges who have been searching through the submissions to settle on a few favorites to honor as the first Fashion Week winners. Here are picks for each class!
Hunters
Worg
Waidelotte
Narhzul
Warlocks
Morrigh4n
Danni
TheMergingWheat
Titans
TadsJr
AFatalChick
Crissis
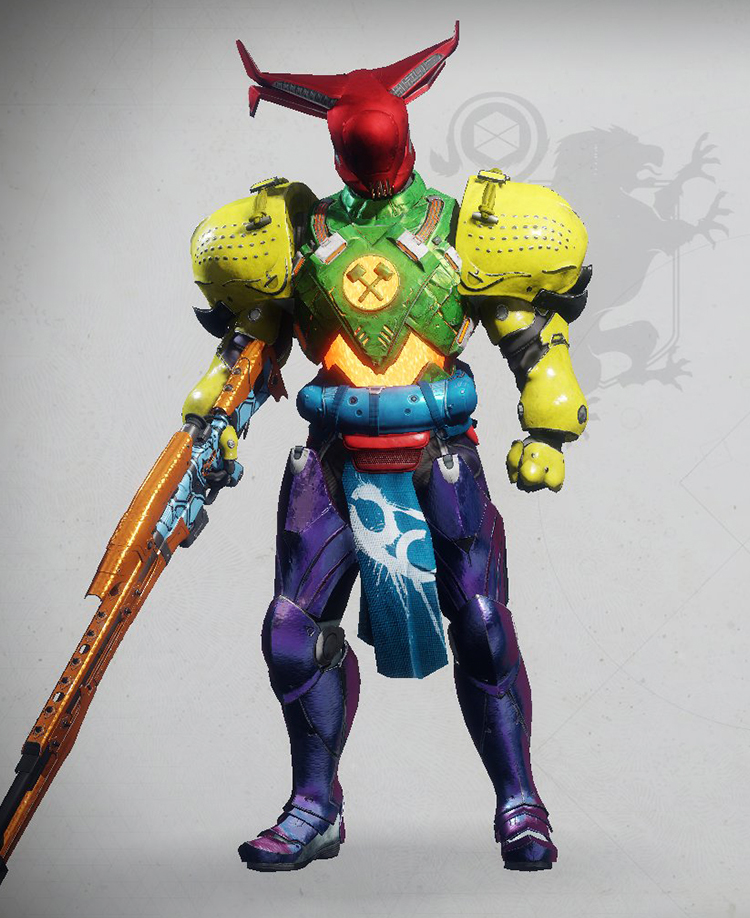
Other Guardians also caught our eye. Fashion is subjective, and though this Guardian’s look may be considered “unconventional,” they wore it loud and proud. Here is our honorable mention.
Honorable Mentions
Angel Montero
All of the Guardians mentioned will receive a special emblem as a badge of honor. If you would like to be featured here and claim that emblem as your own, keep an eye out for the next Fashion Week in a future TWAB for how to submit.
Forges and Festivals
Player Support has everything you need to know for next week’s update.
This is their report.
Destiny 2 Update 2.6.1
Next Tuesday, Destiny 2 Update 2.6.1 is scheduled to go live. This update will introduce a broad variety of changes to the player experience, and resolves a number of known issues that have emerged since the launch of Shadowkeep. Here are some highlights:
Resolved an issue that prevented some veteran players from unlocking Black Armory forges and completing the Mysterious Box quest for Izanagi’s Burden.
Resolved an issue that prevented players from abandoning the Mysterious Box quest for Izanagi’s Burden on alt characters—it will be retrievable from Ada-1.
Resolved an issue where the Exodus Black destination quest could not be recovered if abandoned—it will be retrievable from Failsafe.
Resolved an issue which prevented some players from earning the “Silimar’s Design” Triumph—this Triumph will unlock retroactively for eligible players.
Resolved an issue causing daily bounties from Eris Morn and the Lectern of Enchantment to rotate weekly.
Resolved an issue that increased load times for previewing gear while traveling between destinations.
Additionally, we’d like to remind players that we’ve resolved an issue causing crashes in the Gofannon Forge in Hotfix 2.6.0.4. Players who previously encountered issues engaging with Black Armory content are highly encouraged to try again once Update 2.6.1 becomes available next Tuesday.
As with all updates and hotfixes, players should follow @BungieHelp on Twitter or monitor our support feed on help.bungie.net for the latest details as soon as they are available.
Festival of the Lost
Also next Tuesday, Festival of the Lost returns to Destiny 2. In case you missed it in our blog earlier this week, we encourage all players to take a look at our official Festival of the Lost Guide.
Before Eva Levante returns to adorn the Tower in ghoulish decor, we’d like to inform players of what they can do right now to prepare for the festival’s return.
Brand-new players who go through the New Light experience must achieve at least 770 Power before Eva Levante will beckon them with her Festival of the Lost introductory quest. If these players are lower than 770 Power, they will not be able to interact with Eva Levante at all.
All veteran players, including those who were boosted to 750 Power at the launches of New Light and Shadowkeep, may head directly to Eva Levante once Festival is live to begin her quest.
While New Light players must achieve 770 Power before they can jump in, the Haunted Forest has a minimum recommended Power of 750—so all Guardians should be ready to jump right in.
Additionally, while we await the festival’s return, we’d like to forewarn players about earning and deleting Candy and Chocolate Strange Coins. In order to earn these currencies, players must wear the Masquerader’s Helmet, purchasable from Eva Levante for 100 Glimmer. If players defeat enemies and complete activities without this helmet equipped, they will not earn Candy or Chocolate Strange Coins.
Furthermore, players should be cautious when dismantling any items in their Consumables inventory. Any instance of dismantling Candy or Chocolate Strange Coins, intentional or otherwise, will delete the entire stack.
Players who encounter issues following the launches of Update 2.6.1 and Festival of the Lost should report them to the #Help forum.
New Movies
Every week, we’re on the lookout for community-created videos. We take our favorites and feature them here for all to see, and the winners receive a special emblem. In fact, starting this week, we have a new emblem for all future MOTW winners.
Looks good right? Here are the first to take it home:
Movie of the Week: No Guns
Honorable Mention: Memento Mori
Don’t forget we’re also kicking off our Game2give charity event next week. Learn more about how you can participate by either donating or joining a fundraising team!
I don’t know about you, but I’m looking forward to next week. We stacked up a lot of new things to go live, and I’m having a hard time deciding what to do first!
Update (2nd Nov, 01:10 BST): In a statement given to ArsTechnica, Amazon has responded to the restrictions placed upon third-party sellers (see original article below). The restrictions were supposedly put in place “in error” and have since been reversed.
Yesterday’s email [to third-party Amazon sellers] was sent in error, and all impacted listings were reinstated within hours.
Original Article (1st Nov, 16:15 BST): Major online retailer Amazon has implemented a new system whereby third-party stores hoping to sell Nintendo products must first seek direct approval, potentially having a huge impact on the sale of used games and consoles.
The news comes from an email which has been sent to a number of third-party sellers who operate on Amazon’s digital storefront. It notes that the new requirements technically came into effect yesterday, 31st October, and warns that any products listed from now on “will be removed”. Here’s a snippet:
As part of our ongoing efforts to provide the best possible customer experience, we are implementing approval requirements for Nintendo products. Effective on 2019-10-31, you will need approval to list the affected products. If you do not obtain approval to sell these products prior to 2019-10-31, your listings for these products will be removed.
As reported by ArsTechnica, sellers have been experimenting to discover exactly what this means. It would appear that if a product’s producer is listed as ‘Nintendo’ – which would include any first-party games or consoles – it can no longer be listed in ‘used’ or ‘collectable’ condition. Some sellers have reported that they can list items in ‘new’ condition, and that third-party games on Nintendo platforms (meaning any title published by a studio other than Nintendo) can still be listed as before.
The move has sparked some rather heated discussion amongst Amazon’s third-party sellers, with one person accusing the retailer of “shutting everyone down so they can sell the items for more money”. The change actually comes after a string of similar changes to Amazon’s policies on the sales of items like DVDs and Apple products, and appears to be an attempt at cracking down on the sale of counterfeit products, of which plenty can be found online.
It’s unclear whether it was Amazon or Nintendo which decided to enforce the change, although other gaming platform holders Sony and Microsoft haven’t received the same new rulings. Many sellers who make a substantial profit from the resale of used Nintendo games have understandably been left concerned by the news.